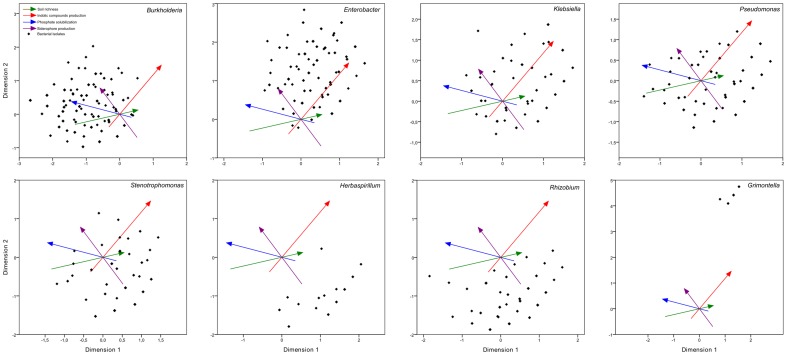
Figure 9. CatPCA analysis of 2,211 bacterial isolates (the legend and interpretation are similar to those of Fig. 2).
The genera Burkholderia, Enterobacter, Klebsiella, Pseudomonas, Stenotrophomonas, Herbaspirilum, Rhizobium, and Grimontella are represented one at a time. Each black dot represents an isolate, but isolates with the same characteristics are stacked on the same dot.

