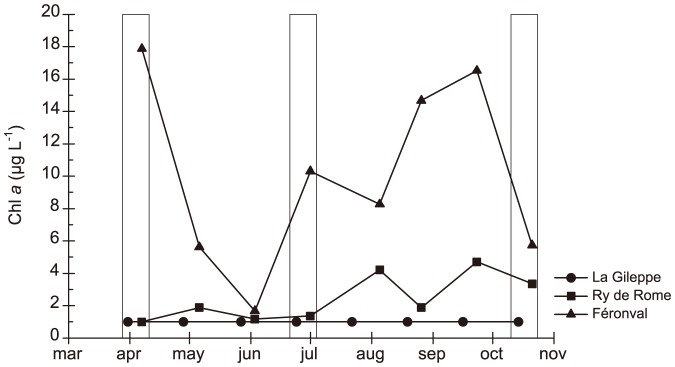
Figure 1. Chlorophyll a concentrations.

Chlorophyll a concentrations (average values from the three analysed water layers) from April to October 2010 measured in La Gileppe (dot), Ry de Rome (square) and Féronval (triangle). Boxes indicate sampling periods for both chemical and BCC analyses.
