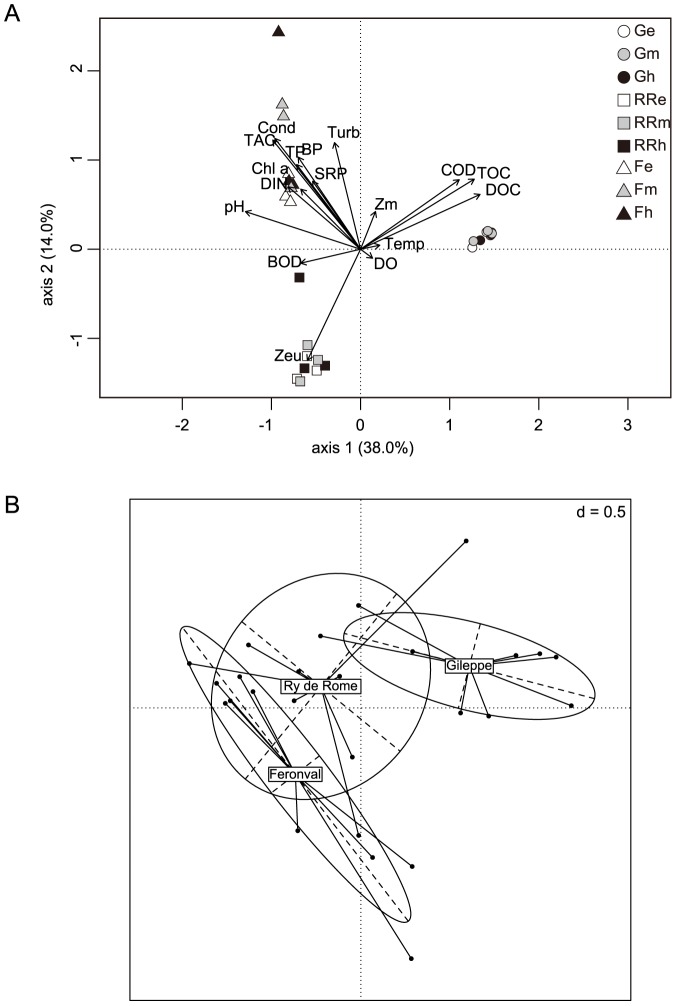
Figure 6. Canonical and Factorial correlation analyses.
Canonical correlation analyses (A) and factorial correspondence analysis (B) of bacterial communities based on relative abundance at OTU level (0.03 cut-off) and environmental parameters in the analysed reservoirs and all sampling dates. Legend: G, La Gileppe (dots); RR, Ry de Rome (square); F, Féronval (triangles); e, epilimnion (white); m, metalimnion (grey); h, hypolimnion (black); 04, April 2010; 07, July 2010; 10, October 2010.

