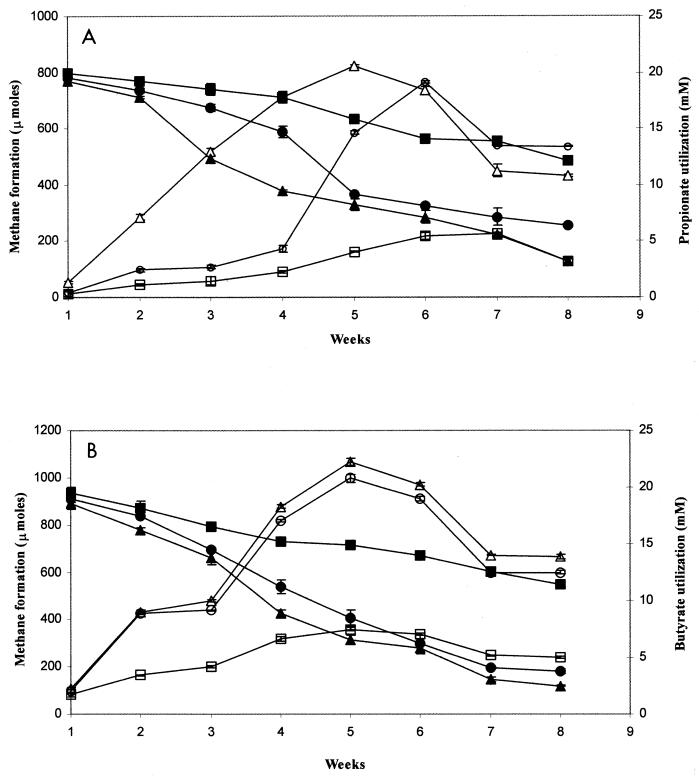
FIG. 1.
Quantification of weekly depletion of 20 mM spiked fatty acids (filled symbols) in WCA-2A soils leading to formation of methane (open symbols). (A) Propionate; (B) butyrate. Symbols: triangles, F1 (eutrophic); circles, F4 (transition); squares, U3 (oligotrophic). Analyses were conducted in triplicate, and mean values are presented; error bars represent ±1 standard deviation.

