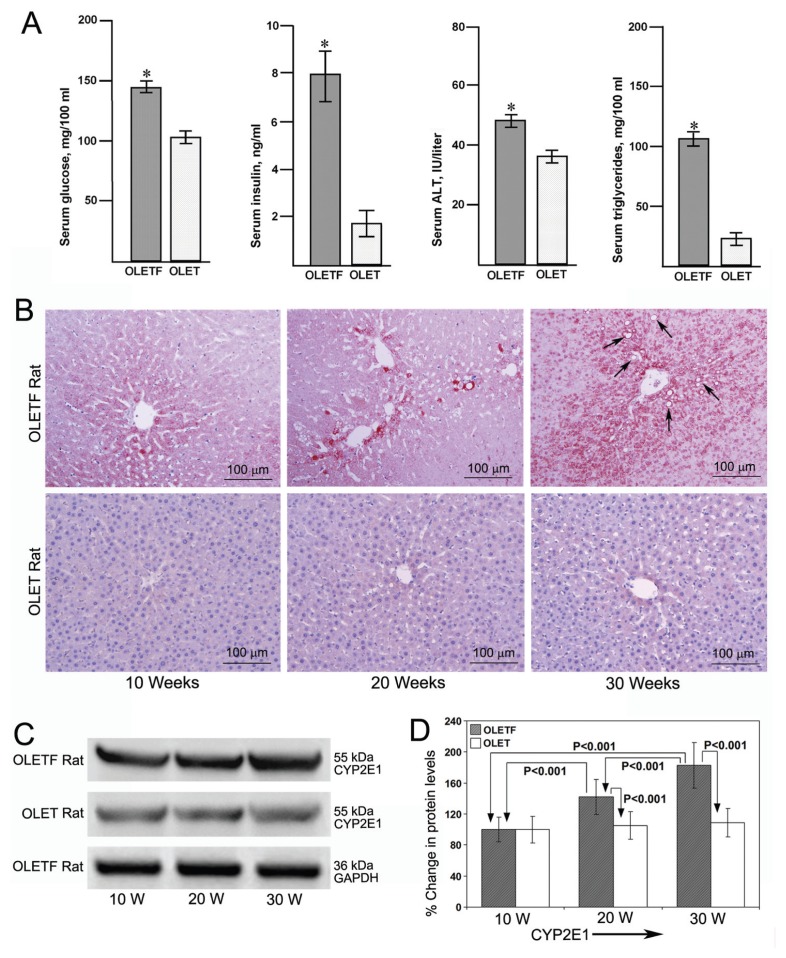
Figure 1.
Serological and histological findings and CYP2E1 protein levels in OLETF and OLET rats aged 30 wks. (A) Serum levels of glucose, insulin, alanine transaminase (ALT) and triglycerides (TG) in OLETF and OLET rats aged 30 wks. *P < 0.001, OLETF rats versus OLET rats (n = 10). (B) Immunohistochemical staining for CYP2E1 in liver tissues from OLETF and OLET rats aged 10, 20 and 30 wks (×100). Marked increase in the staining pattern of CYP2E1 in comparable with aging in OLETF rats but not in OLET rats. (C) Western blotting for CYP2E1 in the liver tissues from OLETF and OLET rats aged 10, 20 and 30 wks. Data are representative of eight rats per each group. (D) Quantitative analysis of Western blot images. Data are mean ± SD of eight images per group. *P < 0.001, OLETF rats aged 20 and 30 wks versus 10 and 30 wks versus 20 wks and OLETF rats versus OLET rats at 20 and 30 wks.

