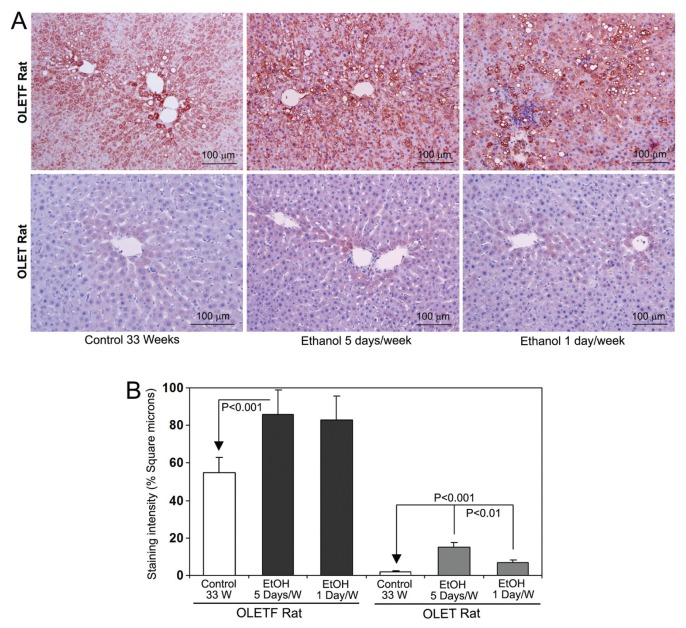
Figure 5.
Immunohistochemical staining of CYP2E1 in the liver tissues from OLETF and OLET rats without and with ethanol (EtOH) treatment. The images are representative of eight rats per group. (A) Marked increase of CYP2E1 staining in the pericentral areas of both untreated and ethanol-treated OLETF rats. (B) Quantitative data of CYP2E1 staining intensity. Data are mean ± SD of eight rats per group. P < 0.001, untreated versus all groups of ethanol-treated in both OLETF and OLET rats. Original magnification 100×.

