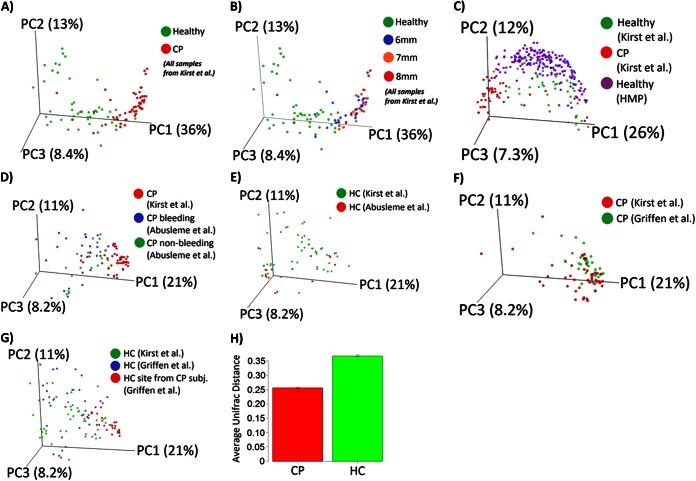
FIG 2.
Comparison of subgingival microbial community composition. Weighted UniFrac analysis was used to generate distances among different samples. Scattered plots were then generated by using principal coordinate analysis. The percentage of variation explained by each principal coordinate (PC) is indicated on the axes. Each point represents a microbial community. (A) Microbial communities in subjects with chronic periodontitis versus healthy controls. (B) Microbial communities in subjects with chronic periodontitis at pocket depths of 6 mm, 7 mm, and 8 mm versus healthy controls. (C) Subgingival microbial communities in this study versus the subgingival data set from the Human Microbiome Project. (D) Bleeding sites and nonbleeding sites from the study by Abusleme et al. (31) versus sites from subjects with chronic periodontitis in this study. (E) Healthy sites from the study by Abusleme et al. versus healthy sites from this study. (F) Chronic periodontitis sites from the study by Griffen et al. (30) versus CP sites from this study. (G) Healthy sites from subjects with chronic periodontitis and healthy sites from healthy controls from the study by Griffen et al. versus healthy sites from this study. (H) Average UniFrac distance between pairs of samples within each group, indicating lower heterogeneity in subgingival microbial communities in the chronic periodontitis group. Error bars indicate standard errors of the means.

