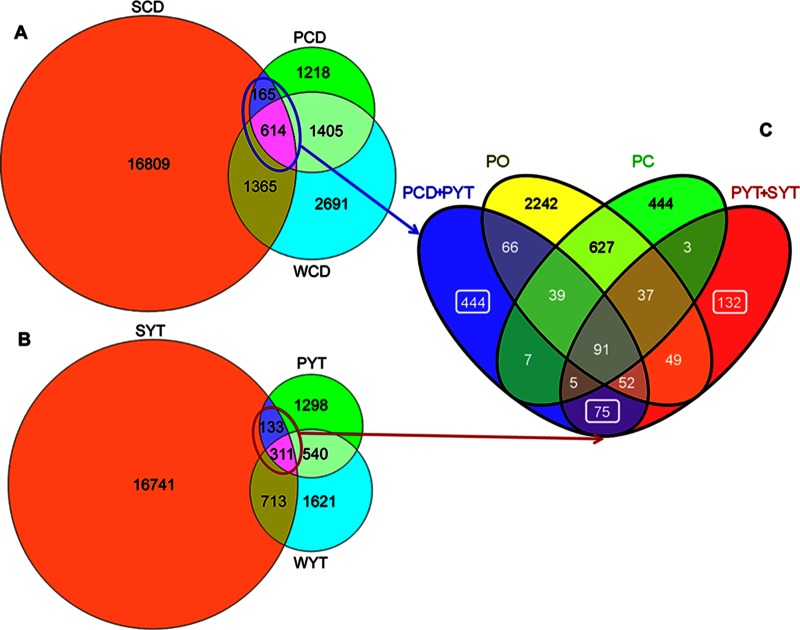
FIG 6.
Venn diagram showing the number of shared and unique OTUs in different sample groups. (A) Shared and unique OTUs in the samples of phyllosphere, water, and soil in the CD treatment. (B) Shared and unique OTUs in the samples of phyllosphere, water, and soil in the YT treatment. (C) OTUs shared by phyllosphere and soil (PCD + SCD and PYT + SYT) compared with the original (PO) and control (PC) phyllosphere communities. The numbers marked by squares are OTUs shared exclusively by phyllosphere and soils. All the observed OTUs were used in the analysis. Circles in panels A and B are proportional to the OTU numbers detected in each sample group.

