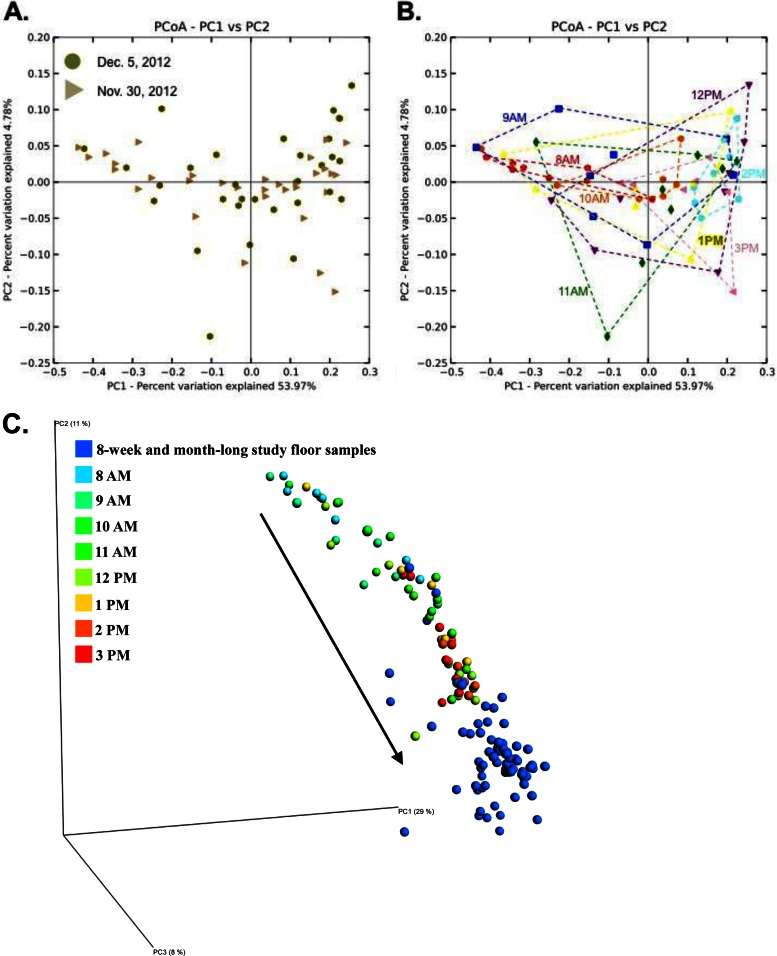
FIG 3.
Principal coordinate (PCoA) plots of floor microbial communities over different timescales. (A) Replicate 8-h time series experiments cluster on top of one another. (B) Same plot as in panel A, but with samples colored by sample collection time point, and time point replicates encapsulated by convex hulls. (C) Samples from the 8-h experiment (rainbow colors) show a larger spread than samples taken from longer-term studies (8-week and 1-month with daily sampling; dark blue), showing that succession is rapid and occurs within 5 to 8 h. The black arrow in panel C shows the successional trajectory.

