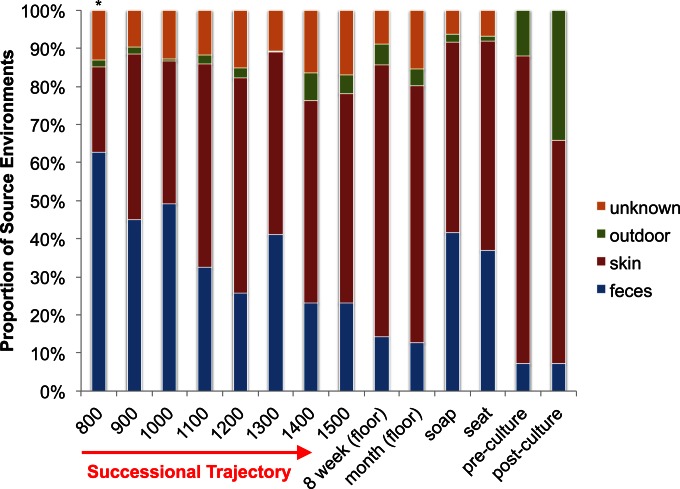
FIG 4.
Relative proportions of OTUs derived from particular source environments (as determined using SourceTracker). The first eight samples represent the averages of replicate samples taken at each hour for the 8-h study. The 8-week and month bars represent the averages of all replicates for floor samples only. The soap and seat bars show the average of replicates for those surfaces across the 8-week and month-long studies. The pre- and postculture bars represent the averages from the human exclusion study (floor samples prior to culturing and after culturing). The asterisk above the 8 a.m. bar indicates that the floor was decontaminated prior to taking this sample. The source environment database was constructed using Earth Microbiome Project (EMP) data (closed reference OTUs; Greengenes release from May 2013). The outdoor category includes database samples from many outdoor environments: freshwater, freshwater microbial mat, freshwater sediment, bird nest, hot spring water, hot spring microbial mat, ice, marine biofilm, marine water, marine sediment, hypersaline water, sand, sandstone, and soil.

