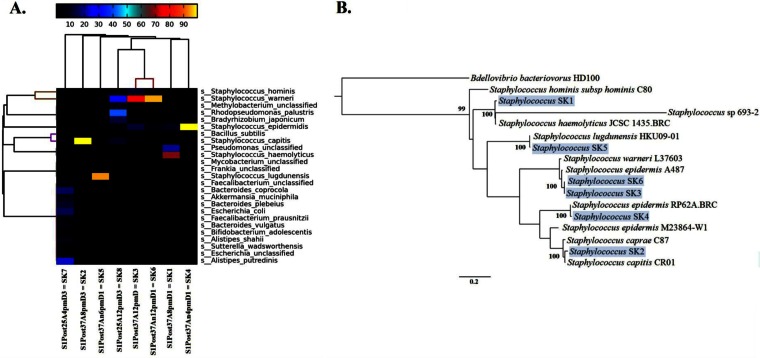
FIG 6.
Species-level metagenomic diversity from metagenomic assemblies of postculture swab samples from the human free study. (A) Species-level (SK1-SK8) relative abundance patterns across eight metagenomes, with hierarchical clustering of both rows and columns (average linkage clusters, using Bray-Curtis distance), reporting only the 25 most abundant species annotations (according to the 90th percentile of the abundances). The heatmap key shows percent relative abundance. (B) Rooted tree showing the phylogenetic positions of six Staphylococcus population genomes (shown on a light blue background), along with reference strains and Bdellovibrio bacteriovorus HD100 as the outgroup. The tree was constructed using PhyloPhlAn (29) with concatenated amino acid sequences from ∼400 conserved proteins. Values assigned to internal nodes within the phylogeny represent bootstrap support (bootstrap values of <0.50 are not reported). Bar, 0.2 changes per amino acid position.

