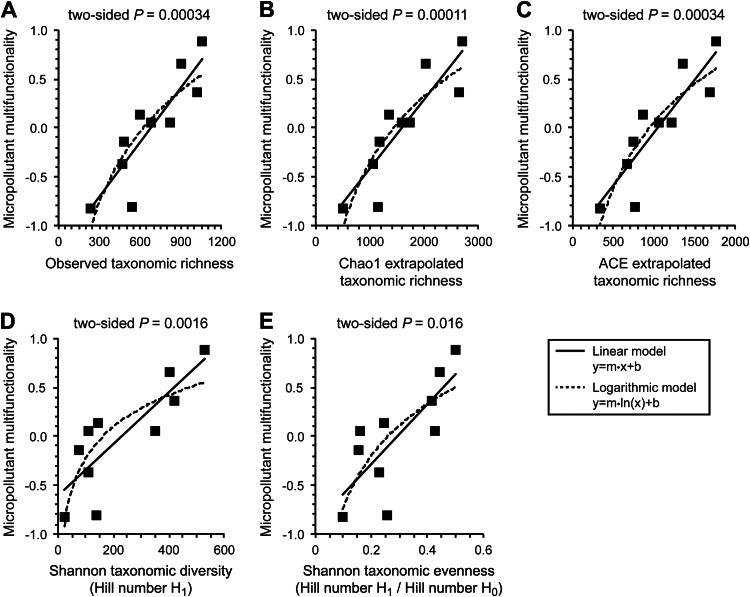
FIG 3.
Association between observed taxonomic richness (A), Chao1 extrapolated taxonomic richness (B), ACE extrapolated taxonomic richness (C), Shannon taxonomic diversity (D), or Shannon taxonomic evenness and micropollutant multifunctionality (E). The solid lines are the best-fit linear models, and the dashed lines are the best-fit logarithmic models.

