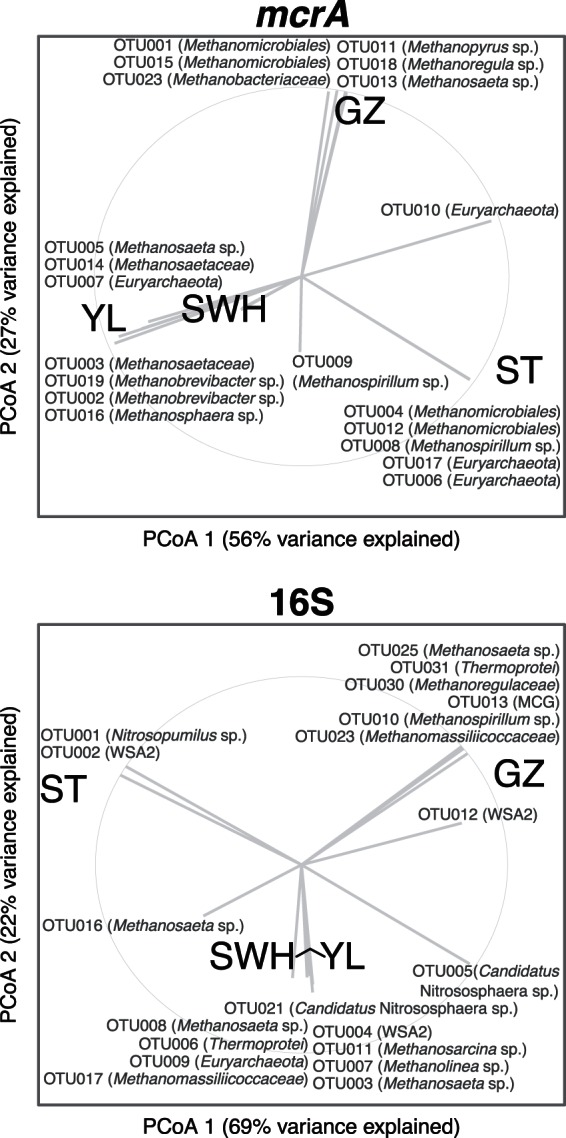
FIG 3.

Principle coordinates analyses (PCoA) of methanogen (mcrA) and archaea (16S) communities. Vectors indicate correlation (ρ) between the abundances of the 20 most abundant OTU and the PCoA axes and should not be interpreted as identifying OTU that explain the variance between digesters. The light gray circle represents ρ = 1.
