
FIG 1.
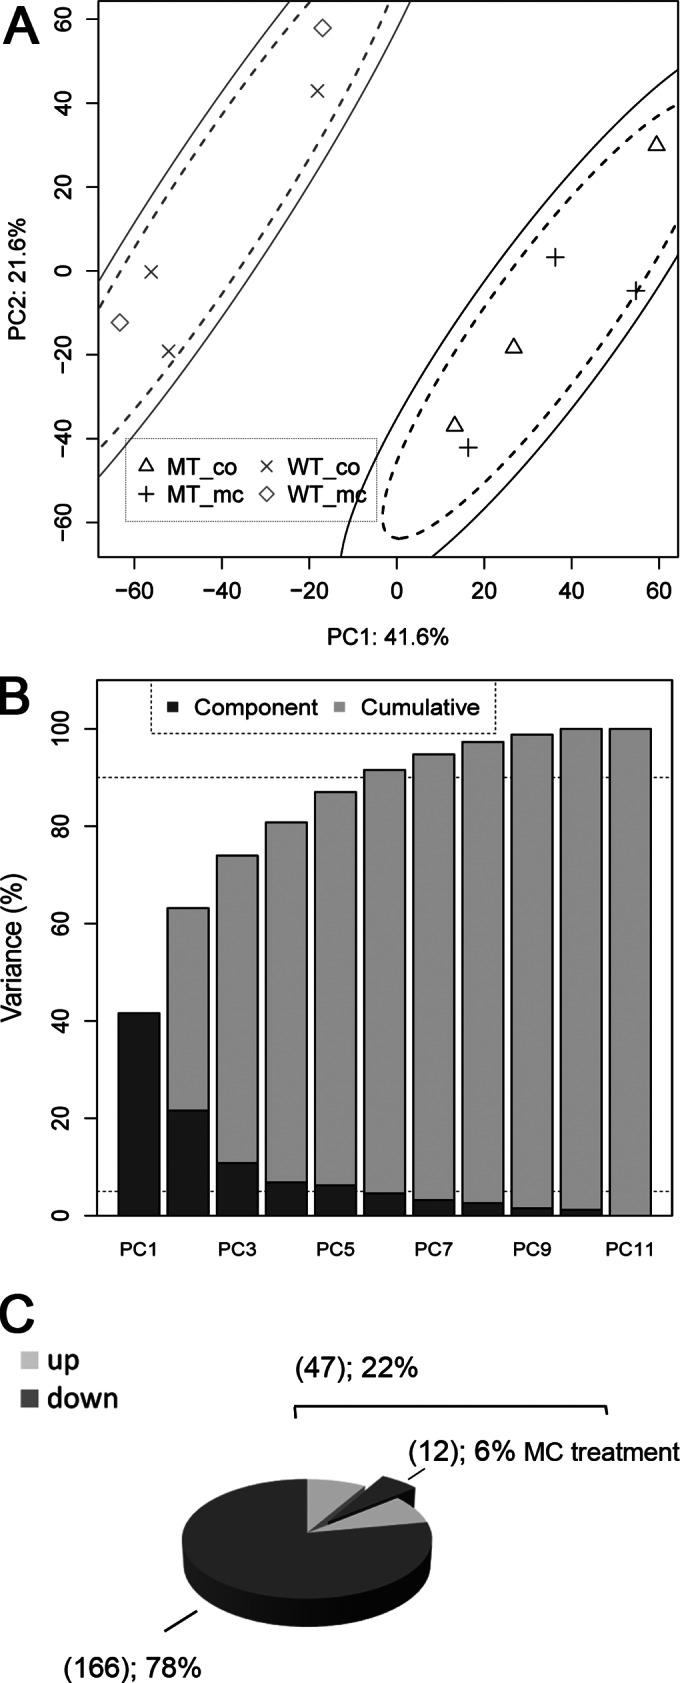
(A) PCA of log2-normalized gene expression data for M. aeruginosa WT and ΔmcyB mutant (MT) cells. As both the 85% (dashed line) and the 95% confidence (solid line) ellipses for PC1 (explaining 41.6% of the overall variance) and PC2 (21.6% variance) separate the genotypes, the cluster separation for the genotypes is highly significant. No separation was observed between controls (co) and MC-LR addition to the cultivation medium (mc). (B) As visible in the scree plot on the right by dashed lines for 5 and 90% variance, the first six principal components together carry more than 90% of the data set variance. (C) Number of genes significantly downregulated (log2-fold change of <−1) or upregulated (log2-fold change of >1) with P values of <0.1 in the ΔmcyB mutant cells compared to the wild type. For 6% of the differentially upregulated genes in the mutant, these effects could be reversed by external MC-LR addition, which provides complementation of the MC knockout in the mutant. No further genes were affected by the external MC-LR treatment under the tested conditions.