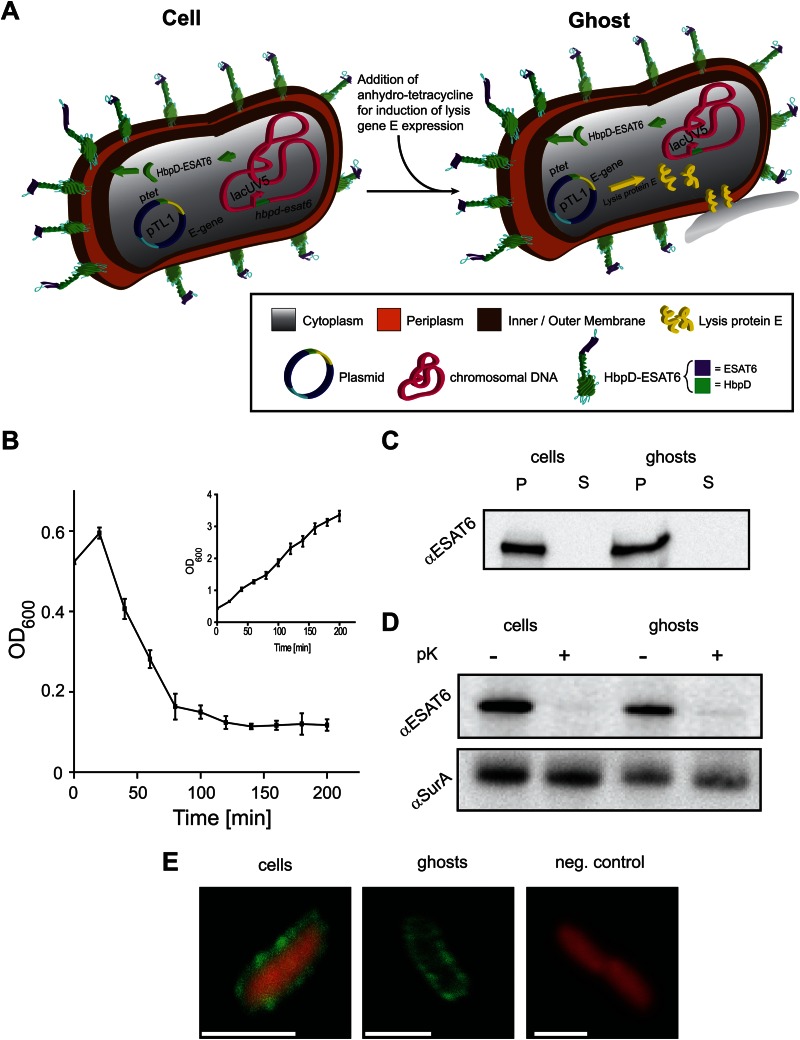
FIG 6.
Hbp-based display of ESAT6 in Salmonella ghosts. (A) In Salmonella strain SL3261HbpD-ESAT6, constitutive expression of hbpd-esat6 is governed by the lacUV5 promoter from the chromosome. Since Salmonella has no lac operon, there is no LacI available, which suggests that expression from the lacUV5 promoter is constitutive. Expression of the gene encoding lysis protein E from the high-copy-number plasmid pTL1 is induced upon the addition of anhydro-tetracycline. (B) Salmonella strain SL3261HbpD-ESAT6 harboring pTL1 was cultured in LB medium at 30°C. Expression of lysis gene E was induced with 0.2 μg/ml anhydrotetracycline during mid-log phase at an OD600 of 0.5 (time = 0 min). The optical density of the culture was monitored at the indicated time points during a period of time of 200 min after induction. The inset represents a culture of Salmonella strain SL3261HbpD-ESAT6 harboring pTL1 to which no anhydrotetracycline was added. n = 3, error bars indicate ±SD. (C) The presence of HbpD-ESAT6 in cells and ghosts and the media from which they were isolated was monitored by SDS-PAGE/immunoblotting using anti-ESAT6. (D) Top panel, surface exposure of HbpD-ESAT6 in cells and ghosts was monitored by means of proteinase K accessibility combined with SDS-PAGE/immunoblotting using anti-ESAT6. Bottom panel, cell envelope integrity during the procedure was demonstrated by showing the inaccessibility of the periplasmic chaperone SurA to proteinase K using anti-SurA. (E) Visualization of cells by confocal fluorescence microscopy. Left panel, Salmonella SL3261HbpD-ESAT6 cells harboring pTL1 were incubated with a monoclonal antibody against ESAT6 and a secondary anti-mouse antibody labeled with Oregon Green 488. As before, ethidium bromide was used as a cytoplasmic marker. Middle panel, Salmonella SL3261HbpD-ESAT6 cells harboring pTL1 cultured in the presence of anhydrotetracycline (for induction of the expression of lysis gene E) were treated and visualized as described for the cells in the left panel. Right panel, as a control, plain SL3261 Salmonella cells were subjected to the same treatment as the cells in the left and middle panels. Bars, 1 μm.

