Figure 2.

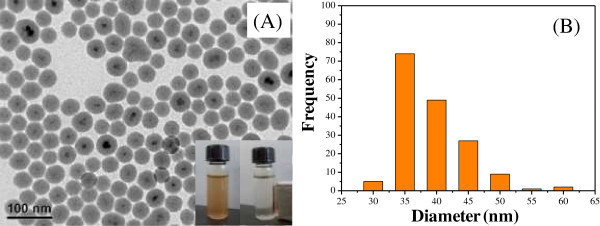
Typical TEM images and particle size distributions of the MNPs@SiO2. (A) TEM image and the (B) particles size histogram of MNPs@SiO2.

Typical TEM images and particle size distributions of the MNPs@SiO2. (A) TEM image and the (B) particles size histogram of MNPs@SiO2.