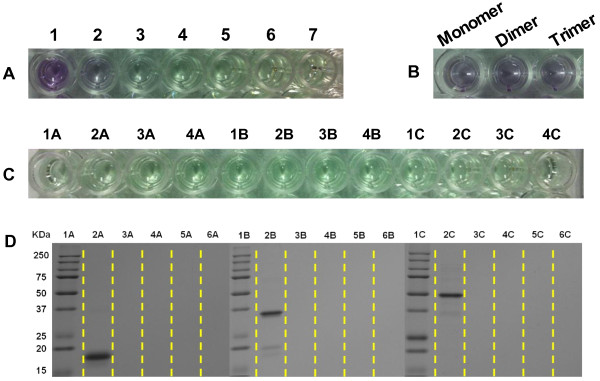
Figure 5.

Photo of concentrations and SDS-PAGE analysis of multimeric proteins. The photo of (A) the BSA standards at the following concentrations (μg/mL) for 1–7, respectively, 200, 100, 50, 25, 12.5, 6.25, and 0; (B) the multimeric protein G (100 μg/mL); (C) supernatants after binding reaction for the CTMS-MNPs@SiO2 with His-tagged monomer, dimer, and trimer protein G, respectively, 1A, 1B, and 1C, and the function washed off from the His-tagged multimeric protein G on the CTMS-MNPs@SiO2, respectively, 2A-4A, 2B-4B, and 2C-4C; and (D) SDS-PAGE analysis of multimeric protein: lanes M marker; lanes 1A, 1B, and 1C: His-tagged monomer, dimer, and trimer protein G, respectively; lanes 2A, 2B, and 2C: supernatants after binding reaction for the CTMS-MNPs@SiO2 with His-tagged monomer, dimer, and trimer protein G, respectively; lanes 3A-5A, 3B-5B, and 3C-5C: the function washed off from the His-tagged multimeric protein G on the CTMS-MNPs@SiO2.
