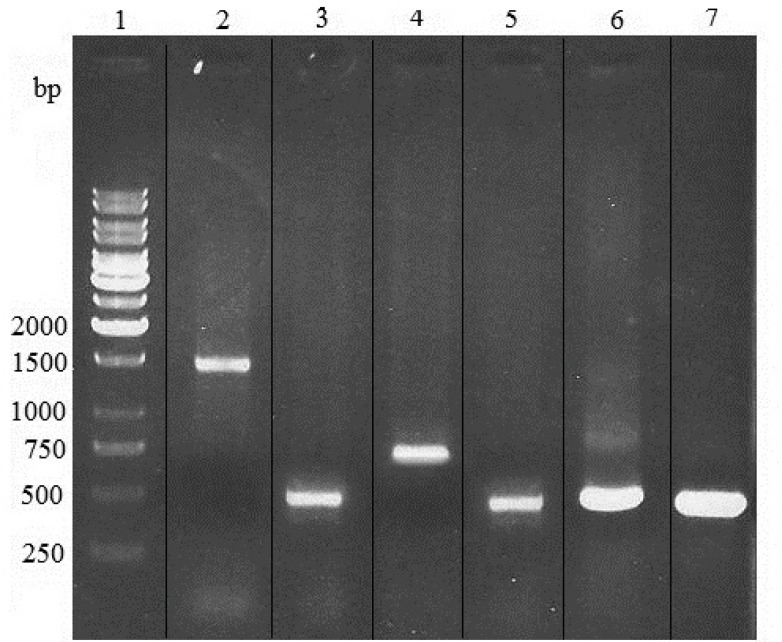
Figure 2.
PCR analysis of genomic DNA from zeocin/blasticidin-resistant Sp2.0 cells. PCR products were electrophoresed on a 1% agarose gel. Lane 1, 1kb DNA markers; lane 2, amplification of heavy chain gene from DNA of resistant Sp2.0 cells; lane 3, amplification of variable region of heavy chain gene from DNA of resistant Sp2.0 cells; lane 4, amplification of light chain gene from DNA of resistant Sp2.0 cells; lane 5, amplification of variable region of light chain gene from DNA of resistant Sp2.0 cells; lane 6, amplification of variable region of heavy chain from recombinant vector pFUSE-CHIg-hG4-VH; lane 7, amplification of variable region of light chain from recombinant vector pFUSE-CLIg-hk-VL.

