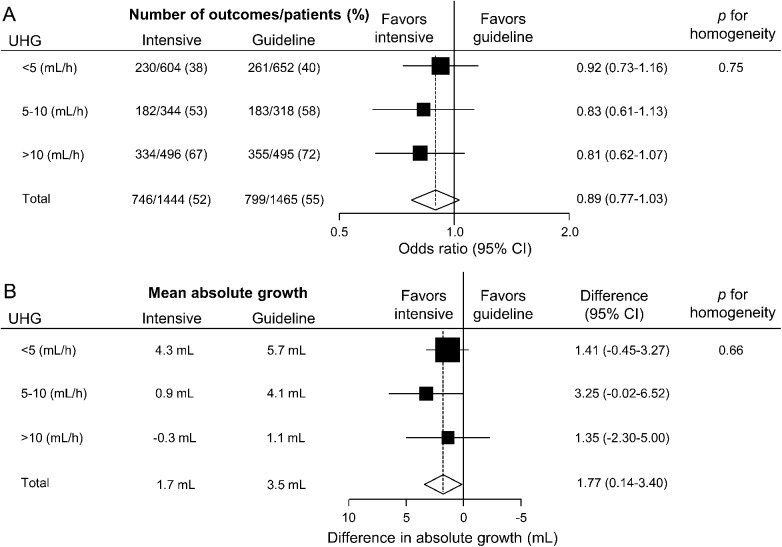
Figure 2. Treatment effects on (A) death or major disability, and (B) absolute hematoma growth by UHG speeds.
Solid boxes represent estimates of treatment effect; horizontal lines, 95% CI; a diamond, the estimate and 95% CI for overall effect. (A) Areas of the boxes are proportional number of outcomes. Results were adjusted for trials. (B) Areas of the boxes are proportional to the reciprocal of the variance of estimates. Results were adjusted for trials and hematoma location. CI = confidence interval; UHG = ultraearly hematoma growth.

