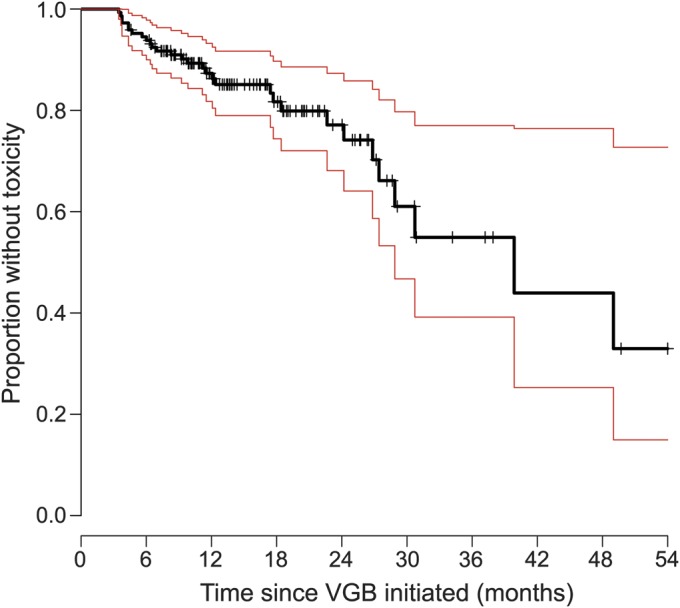
Figure 2. Survival curve showing proportion of children without VGB-RD, according to duration of VGB treatment.

The black solid line represents the Kaplan-Meier estimator of the survival function. Red lines represent 95% confidence limits. The small vertical tick-marks represent withdrawal from the study resulting in censoring of this participant from the sample. VGB = vigabatrin; VGB-RD = VGB-induced retinal damage.
