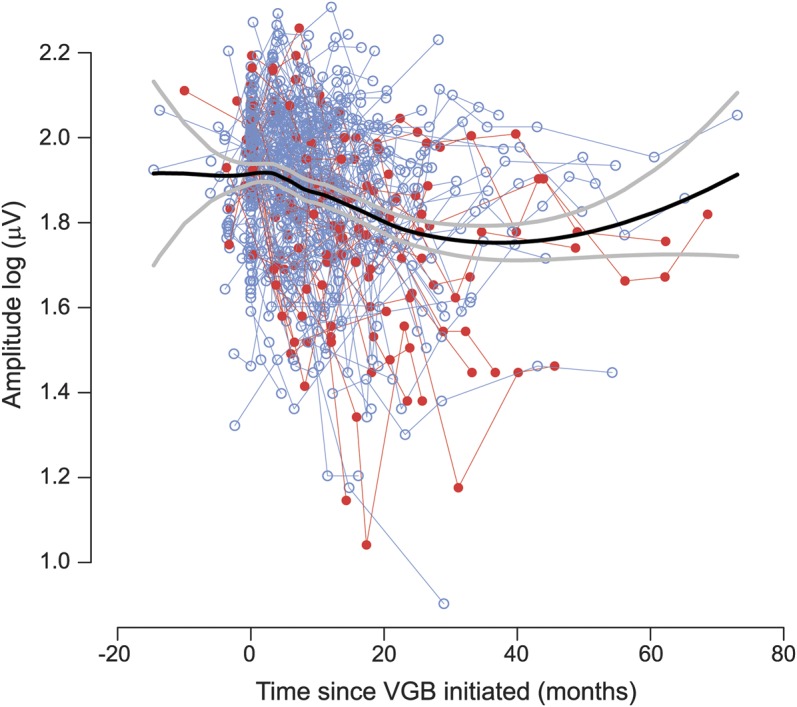
Figure 3. Individual data points of age-adjusted LA 2.29 flicker amplitude plotted against time on VGB in months.

Individual thin lines join data points from individual participants. The thick black line represents the median amplitude. The thick gray line represents the 95% confidence interval. Data plots in red represent cases in which VGB-RD had occurred during the testing period and blue plots represent absence of VGB-RD. Round symbols represent the data points when the child was still receiving VGB. VGB = vigabatrin; VGB-RD = VGB-induced retinal damage.
