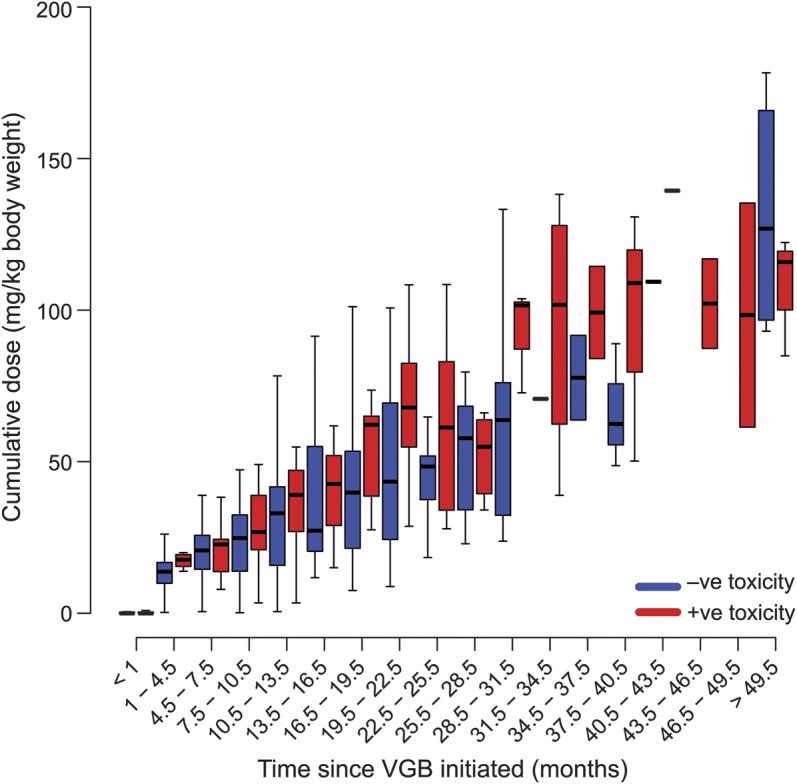
Figure 4. Boxplots showing effect of cumulative dosage on VGB-RD.

The x-axis identifies time bin of drug treatment (time on VGB, months). The y-axis identifies cumulative dose of VGB (g/kg) and red/blue bars identify presence/absence of VGB-RD, respectively. Each individual box represents the range in cumulative dosage. The boxes represent the 25th and 75th percentiles of cumulative dosage and the band near the middle of the box is the median. The ends of the whiskers represent the 1.5th and 98.5th percentile. VGB = vigabatrin; VGB-RD = VGB-induced retinal damage.
