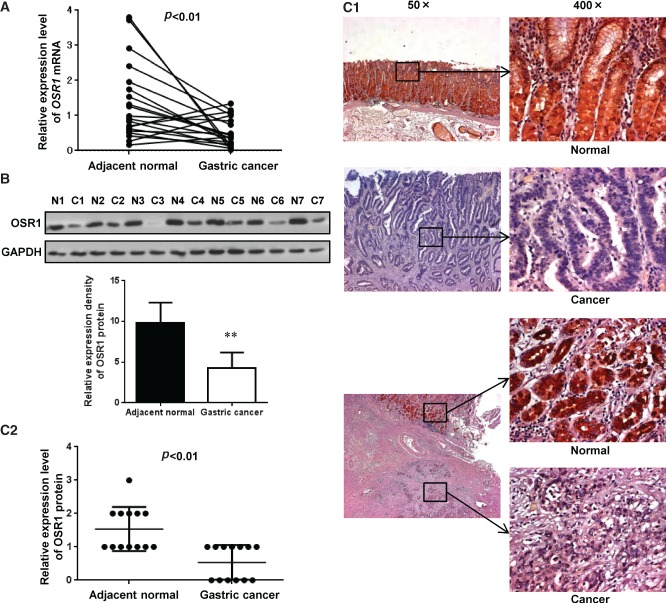
Figure 2.
OSR1 is down-regulated in primary gastric cancer tissues. (A) Expression levels of OSR1 mRNA in 20 paired primary gastric cancer tissues were determined by quantitative real-time PCR. (B) Expression levels of OSR1 protein in seven paired primary gastric cancer tissues were determined by western blotting. Quantitative analysis of the relative expression density is shown in the lower panel. Each column represents the mean ± standard deviation (SD). **p < 0.01 (N, normal; C, cancer). (C1) Expression levels of OSR1 protein in 13 paired primary gastric cancer tissues were determined by immunohistochemistry. Expression of OSR1 protein in normal gastric tissues and gastric cancer tissues is shown. The lower three images indicate cancer cell infiltration under the adjacent normal epithelial mucosa. (C2) Immunohistochemistry scoring was performed according to the percentage of positive tumour cells (0, none; 1, < 20%; 2, 20–50%; 3, > 50%). Each bar represents the mean ± SD.

