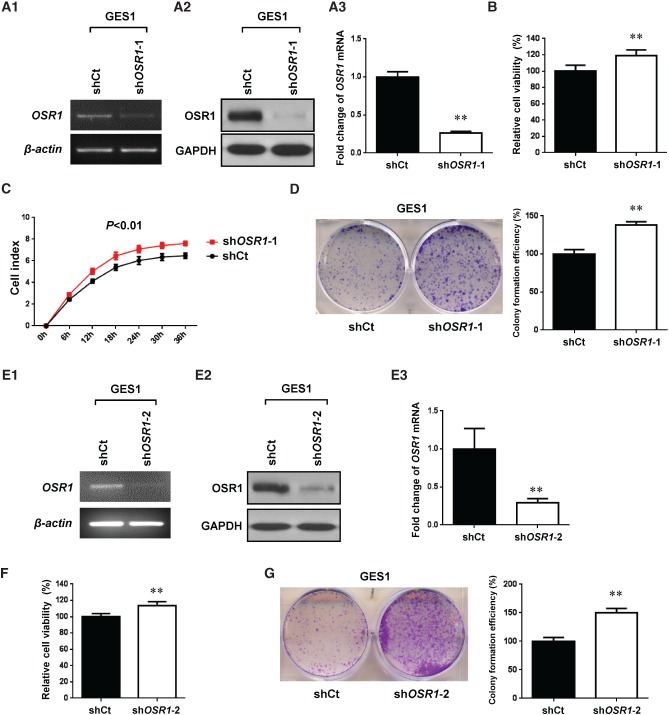
Figure 4.
Knockdown of OSR1 by OSR1-shRNA-1 (A–D) and OSR1-shRNA-2 (E–G) enhances cell growth. (A1) Knockdown of OSR1 mRNA was revealed by semi-quantitative RT-PCR (shCt, shRNA control vector; shOSR1-1, OSR1-shRNA-1). (A2) Knockdown of OSR1 protein was confirmed by western blotting. (A3) Knockdown efficiency of OSR1 mRNA was examined by quantitative real-time PCR. Each column represents the mean ± SD. **p < 0.01. (B) Effect of OSR1 knockdown on cell viability was determined by MTS assay. Each column represents the mean ± SD. **p < 0.01. (C) Effect of OSR1 knockdown on cell proliferation was determined by xCELLigence analysis. Data are shown as mean ± SD. (D) Effect of OSR1 knockdown on colony numbers was determined by colony formation assay. Quantitative analysis of colony formation efficiency (%) is shown in the right panel. Each column represents the mean ± SD. **p < 0.01. (E1) Knockdown of OSR1 mRNA was revealed by semi-quantitative RT-PCR (shCt, shRNA control vector; shOSR1-2, OSR1-shRNA-2). (E2) Knockdown of OSR1 protein was confirmed by western blotting. (E3) Knockdown efficiency of OSR1 mRNA was examined by quantitative real-time PCR. Each column represents the mean ± SD. **p < 0.01. (F) Effect of OSR1 knockdown on cell viability was determined by MTS assay. Each column represents the mean ± SD. **p < 0.01. (G) Effect of OSR1 knockdown on colony numbers was determined by colony formation assay. Quantitative analysis of colony formation efficiency (%) is shown in the right panel. Each column represents the mean ± SD. **p < 0.01.

