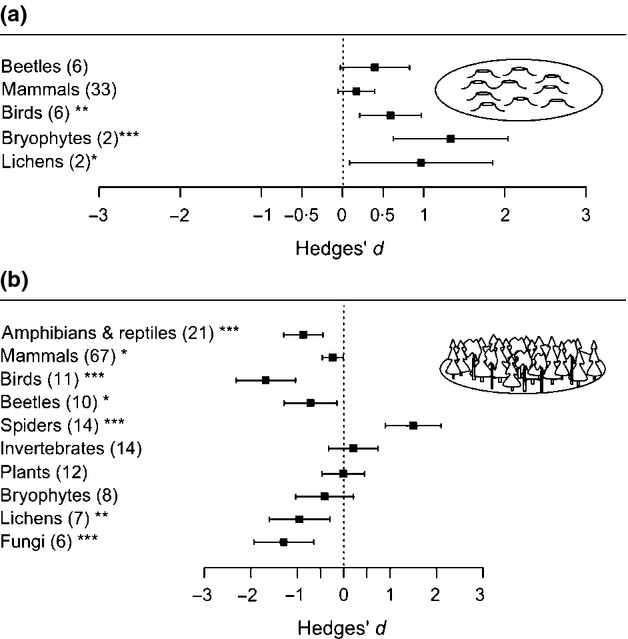
Figure 4.

Effects of retention cuts (mean effect size ± 95% CI) on forest species abundance with clearcut (a) or forest (b) as control. Numbers of observations are stated in brackets. Effects are not significantly different from 0 when 95% CIs include 0. For significant effects, P-values are shown as *P<0·05, **P<0·01 or ***P<0·001.
