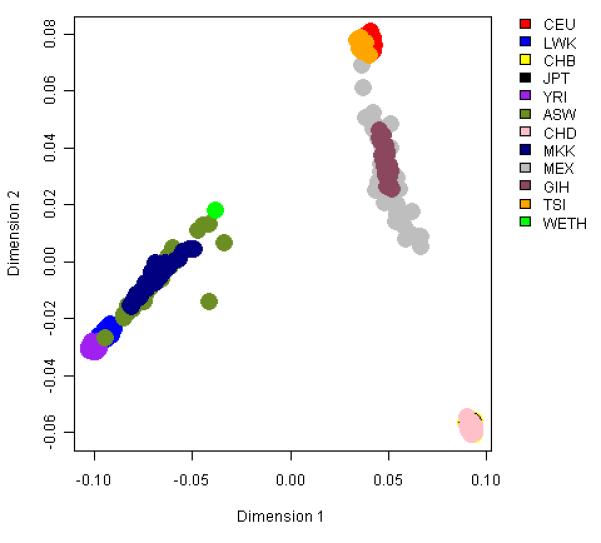
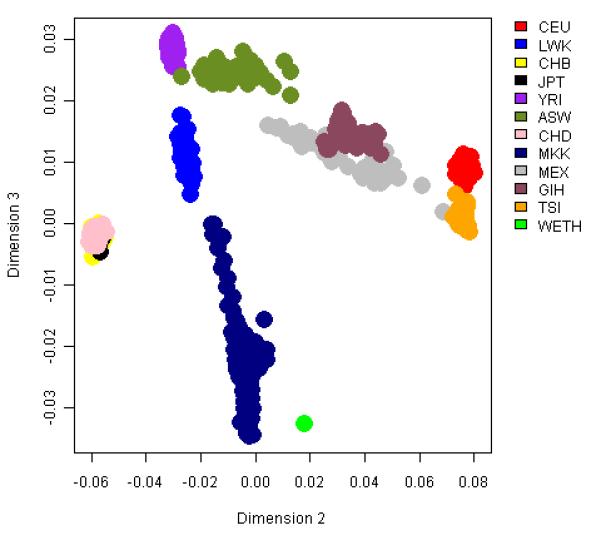
Figure 1. Plots of top three multidimensional scaling analysis of autosomal SNPs in WETH and 11 HapMap population groups.


A Plot of dimensions 1 and 2 which captured 7.95% and 3.72% of the variation. B Plot of dimensions 2 and 3 which captured 3.72% and 0.71% of the variation.
