
Figure 2.
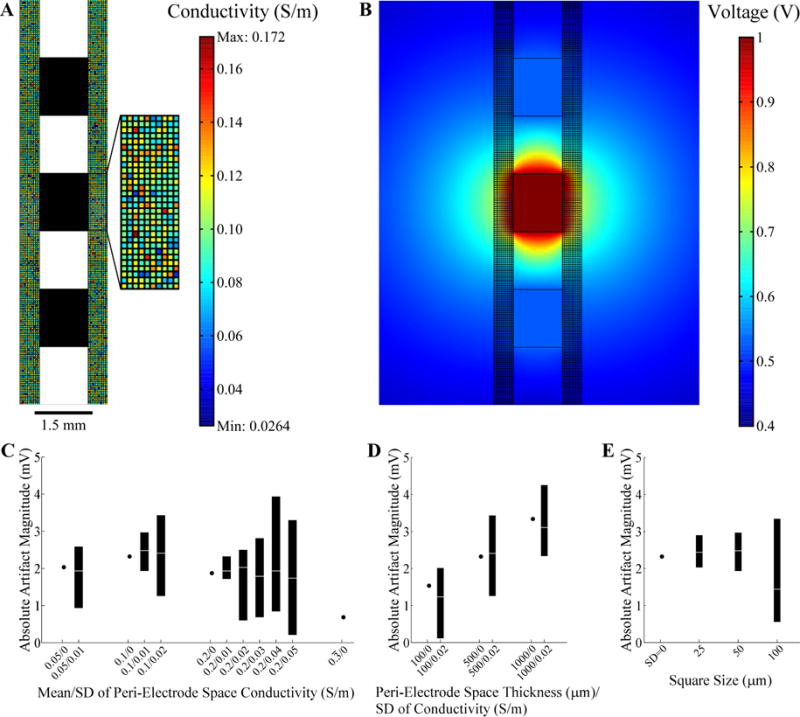
Evaluation of stimulation artifacts using the two-dimensional FEM model of the DBS lead within heterogeneous brain tissue. (A) The peri-electrode space was represented using a checkerboard arrangement, with each square having a random conductivity value (refer to color bar legend), and the remaining brain tissue conductivity was fixed. The average conductivity of the peri-electrode space was 0.1±0.02 S/m (mean ± standard deviation, SD) in the figure. The DBS lead contacts are shown in black. The boundary of the surrounding tissue is not shown. (B) FEM voltage solution resulting from 1 V at contact 1 using the conductivity values shown in (A). (C) The artifact magnitude was calculated for different conductivity values within the peri-electrode space. The thickness of the peri-electrode space was 500 μm and the square size was 50 μm. The range (black bar) and median values (white line) from 10 repeated trials are indicated, except for homogenous conditions (SD=0), in which case a single value is indicated. (D) Artifact magnitude calculated for various thicknesses of peri-electrode space. The SD of conductivity was also varied for each thickness, whereas the mean conductivity was fixed at 0.1 S/m and the square size at 50 μm. (E) Artifact magnitude calculated for different sizes of the peri-electrode space squares. The thickness of the peri-electrode space was fixed at 500 μm and the conductivity was 0.1±0.02 S/m. For reference, the artifact magnitude for the homogenous condition is also indicated.