
Figure 4.
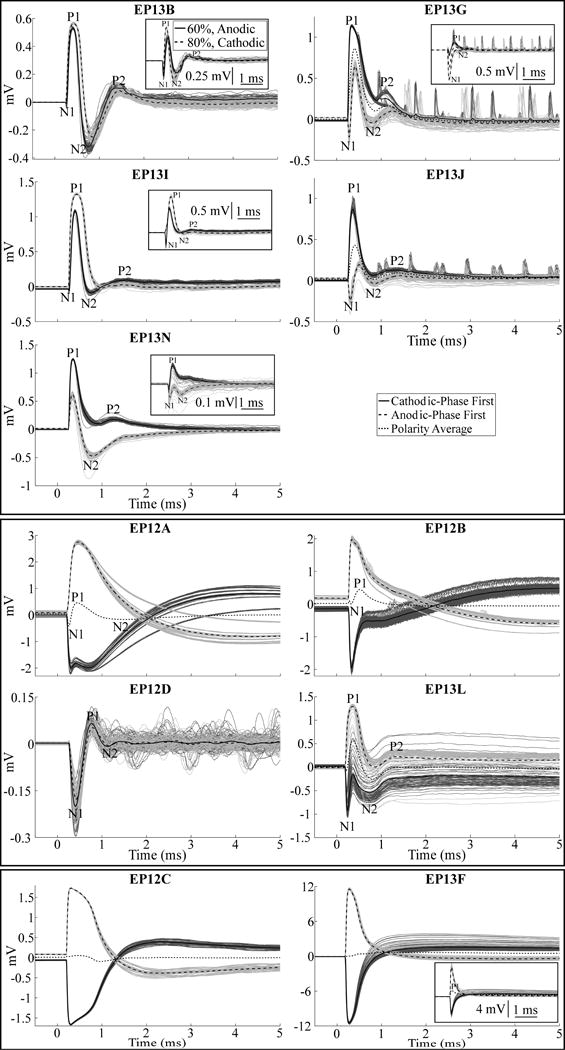
ECAP waveforms recorded during thalamic DBS across subjects, divided into high-fidelity ECAP recordings made in the acute condition (top panel) and chronic condition (middle panel), and two example recordings with large artifacts and negligible ECAP responses (bottom panel). Stimulus-triggered average ECAPs are shown in the bold traces, and single responses are shown as the dark and light gray traces for cathodic- and anodic-phase first polarities, respectively. Other DBS parameters were 130 Hz frequency and an amplitude equal to VCLIN, except for EP12C, EP13J, and EP13L, for which ECAPs are shown with an amplitude that was 60%, 40%, and 59% of VCLIN, respectively, as those were the maximum amplitudes tested in those studies. The insets for EP13B, EP13G, EP13I, and EP13N show ECAP responses for voltages below VCLIN, with cathodic- and anodic-phase first polarities, as well as the polarity average (EP13G only), to demonstrate a more apparent N1 phase. Similarly, the inset for EP13F shows responses for a voltage below VCLIN for cathodic- and anodic-phase first polarities, and the polarity average, to demonstrate the presence of a P1 phase.