
Figure 5.
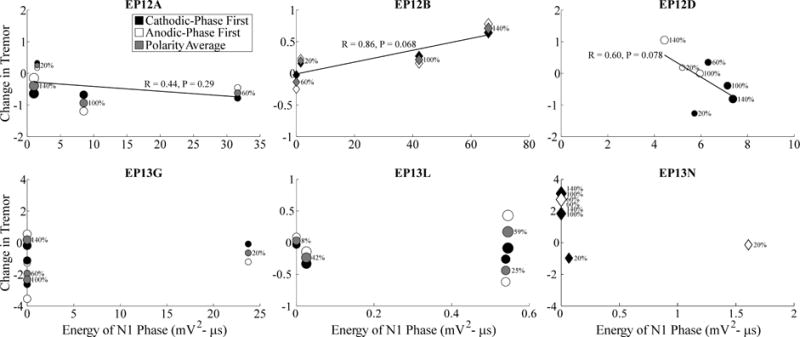
Relationship between changes in tremor and ECAP N1 phase energy across stimulation parameters. Measurements were made across DBS amplitudes, indicated both by the size of the marker and the adjacent text showing amplitude as a percentage of VCLIN, and DBS frequencies, including either 130 Hz or 10 Hz shown with circle and diamond markers, respectively. Further, these data are shown for cathodic- and anodic-phase first polarities with filled and open symbols, respectively. For studies using polarity averaging, one value of the ECAP characteristic is given for both stimulation polarities, and the average of the corresponding tremor measurements across polarities is shown with the gray symbol. Change in tremor was defined such that negative values corresponded to reductions in tremor from baseline, and positive values corresponded to tremor exacerbation. Tremor data was not recorded for EP12D at 130 Hz DBS frequency, 60% of VCLIN, and anodic-phase first polarity, and so the data point is not shown. Despite successful ECAP recording, data is not provided for EP13B and EP13J because a full trial block was not completed, and for EP13I because no tremor was evident in the DBS off condition. Linear regressions were calculated between tremor and ECAP measures, using the polarity average (gray fills) when applicable.