
Figure 8.
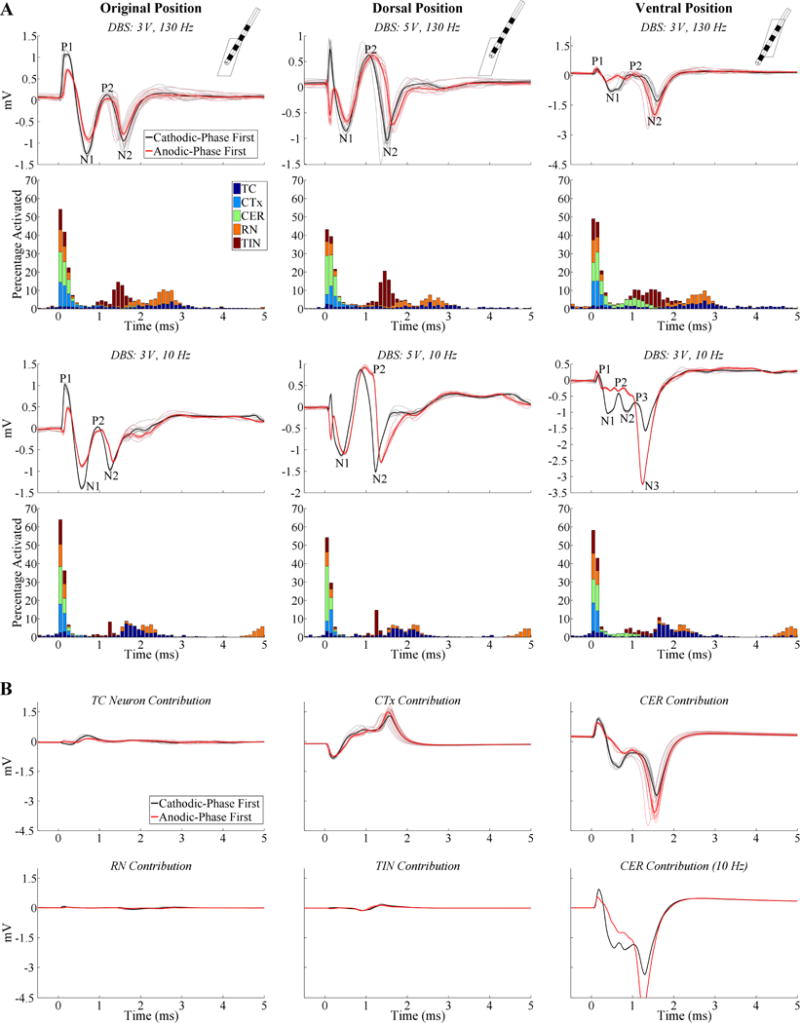
ECAP responses calculated with the model of thalamic DBS using lead model 3387. (A) Model responses for different relative lead positions within the thalamus, including the original position from (26) (left column), dorsal position (center column), and ventral position (right column). The insets in the top row show the FEM geometries of the DBS lead and thalamus from a lateral view. ECAPs are shown for both cathodic- and anodic-phase first polarities, and the corresponding percentage activation of each neural element type in 0.1 ms bins following DBS pulses is shown for cathodic-phase first polarity. DBS amplitudes for each subplot were adjusted to generate similar percentage activation, DBS frequencies were 130 or 10 Hz, and pulse width was fixed at 50 μs/phase. The stimulus-triggered ECAP and single responses are shown in the bold and light traces, respectively, and ECAP phases are labeled. A small stimulus artifact remained with the dorsal lead position following artifact template subtraction, observed as the initial inverted phases for opposite stimulation polarities. (B) The contribution of different neural element types to the composite ECAPs recorded with the ventral lead position at 3 V. The DBS frequency was 130 Hz, unless otherwise designated.