
Figure 9.
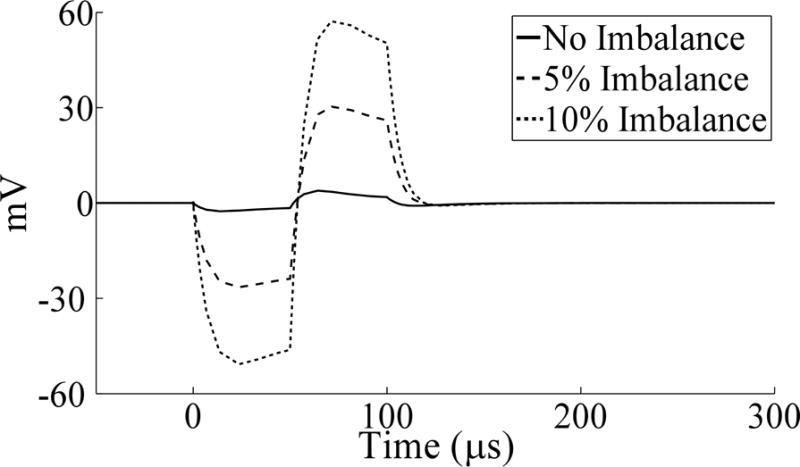
Stimulation artifacts calculated with the electrical circuit equivalent model prior to and following unbalancing of volume conductor resistances, by decreasing RV01 and increasing RV12 by the indicated percentage. The waveforms were independent of stimulation frequency (130 Hz shown). An amplifier blanking scheme was not implemented for the model simulations, and so a triphasic artifact waveform was observed.