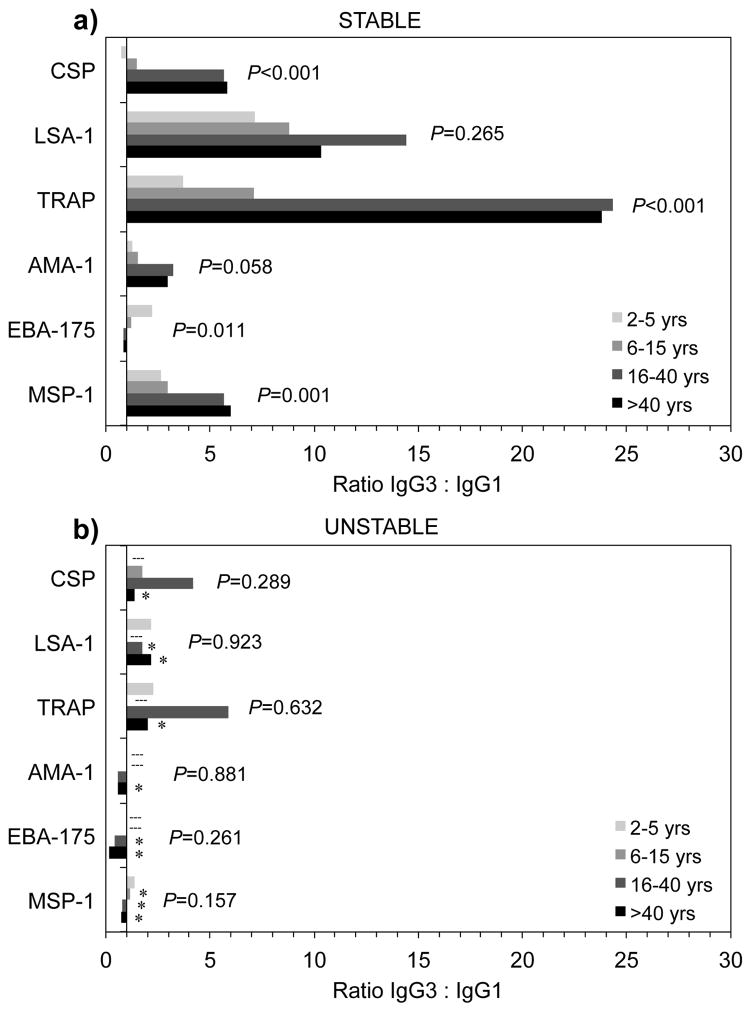
Figure 3.
Median ratio of IgG3 to IgG1 antibodies by age to P. falciparum antigens in areas of stable (a) and unstable (b) malaria transmission among individuals with positive IgG1 and IgG3 responses (greater than 1.0 AU). Dashed line (---) indicates age groups without observations. Asterisk (*) indicates significant (P<0.05) difference in age groups between areas by Wilcoxon rank-sum analysis. P-values indicate trend for age by non-parametric test for trend across ordered groups.

