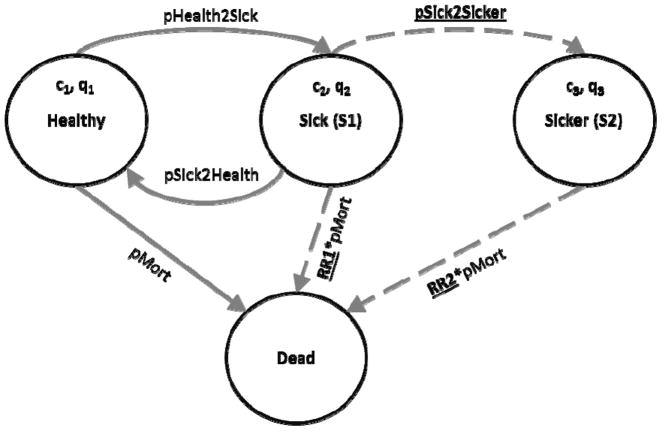
Figure 2.
State transition diagram of a simple Markov model consisting of four health states: Healthy, two illness states (S1 and S2), and Dead. We assume that the illness is associated with higher mortality (RR1, RR2>1), higher healthcare costs (c1<c2<c3), and reduced quality-of-life (ql>q2>q3). Parameters to be varied in calibration are underlined and corresponding transitions are represented with dashed arrows.

