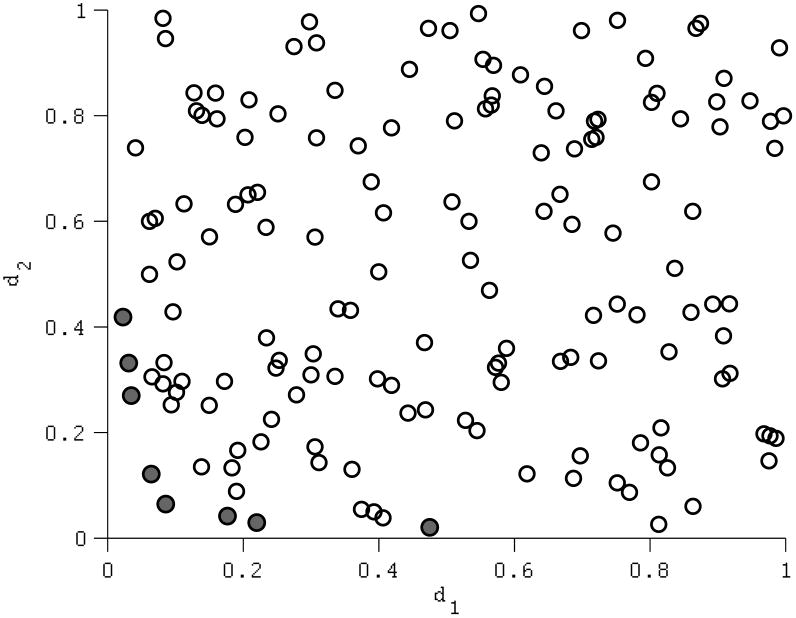
Figure 4.
An illustration of Pareto-optimality in context of two calibration targets. Model input sets are plotted in terms of their fit on each target, d1 and d2, measured, in this case, as the absolute difference between the model output and the calibration target value. Thus, lower values of d1 and d2 represent better fits. Filled circles denote the input sets forming the Pareto-frontier.

