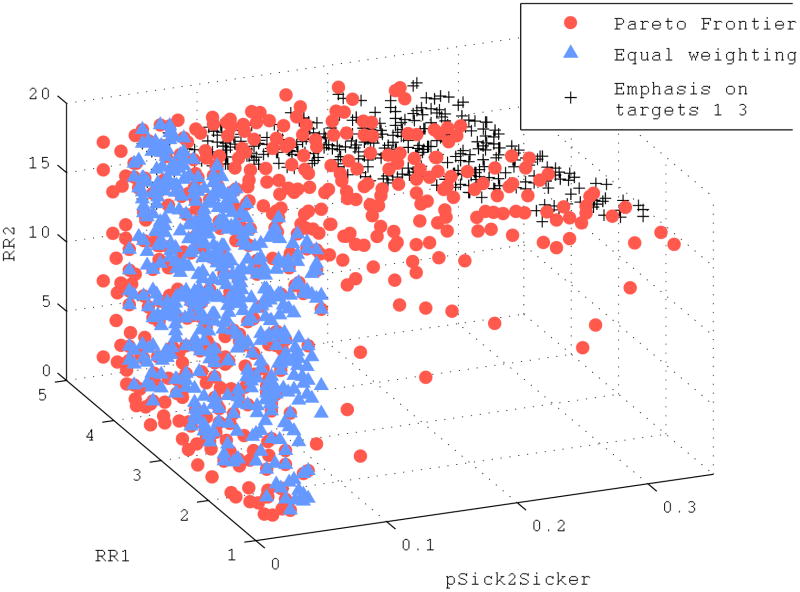
Figure 5.
Input sets on the Pareto frontier (circles) and top 506 best-fitting sets ranked according to an equal weighting of calibration target fits (triangles) and a weighting scheme emphasizing calibration targets 1–3 (crosses) for a simple Markov model. Each input set contains a value for the relative mortality risk in S1 (RR1), the relative mortality risk in S2 (RR2), and the annual probability of transitioning from S1 to S2 (pSick2Sicker).

