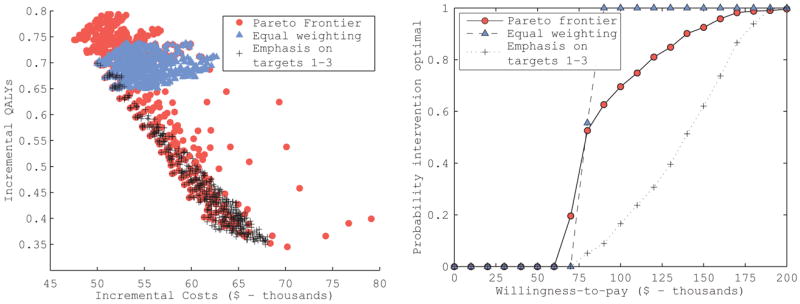
Figure 6.

Cost-effectiveness results of the hypothetical intervention in the Markov model example. The incremental costs and QALYs of the intervention compared to no intervention for each input set on the Pareto frontier (circles) and the top 506 best-fitting sets ranked according to an equal weighting of calibration target fits (triangles) and a weighting scheme emphasizing calibration targets 1–3, which would be based on observational studies (crosses) are plotted. These results were used to generate the cost-effectiveness acceptability curves for the intervention that would be estimated under the different input set ranking approaches.
