Figure 2.

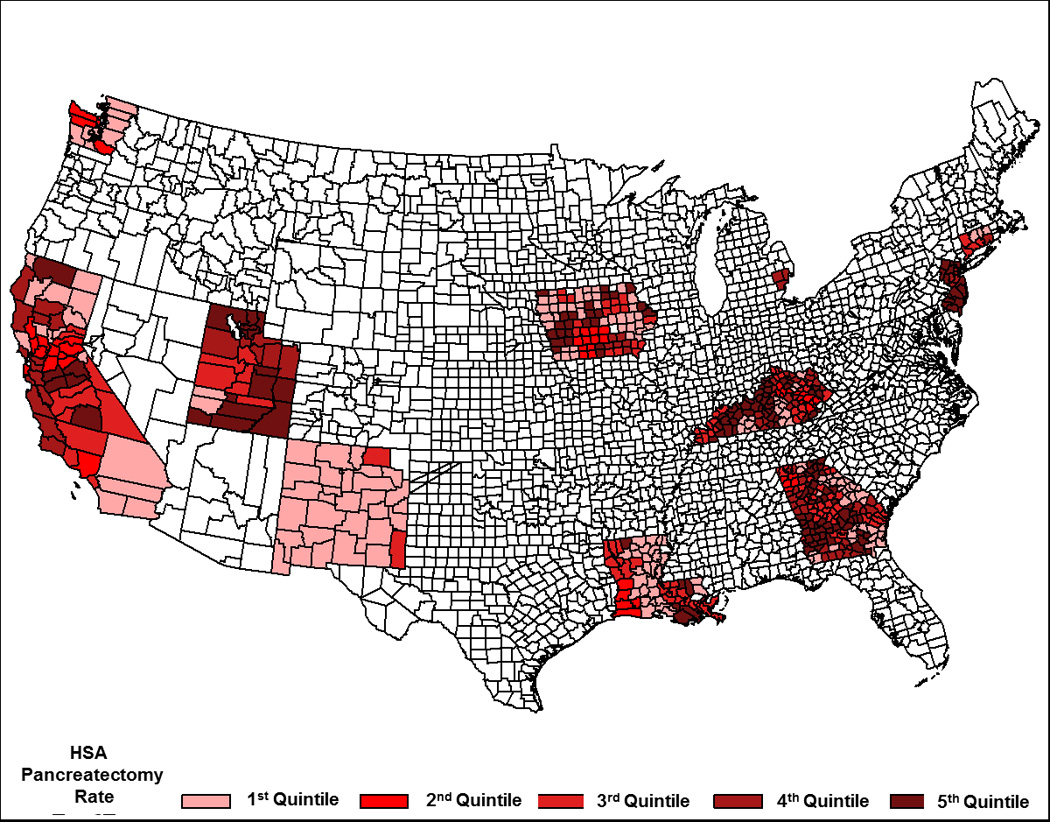
Map of the United States Showing Geographic Distribution of Health Service Area Quintiles. (Quintile 1 = Lowest Rate of Pancreatectomy and Increases to Quintile 5 = Highest Rate of pancreatectomy)

Map of the United States Showing Geographic Distribution of Health Service Area Quintiles. (Quintile 1 = Lowest Rate of Pancreatectomy and Increases to Quintile 5 = Highest Rate of pancreatectomy)