
Figure 2.
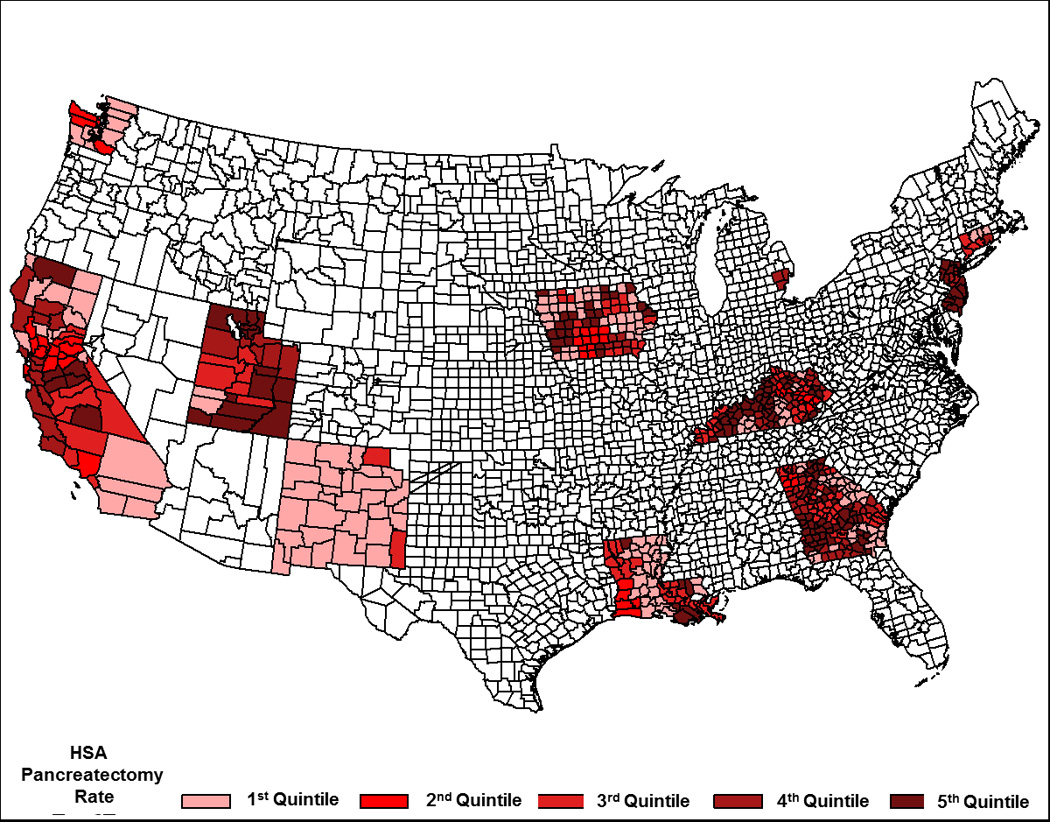
Map of the United States Showing Geographic Distribution of Health Service Area Quintiles. (Quintile 1 = Lowest Rate of Pancreatectomy and Increases to Quintile 5 = Highest Rate of pancreatectomy)
Official websites use .gov
A
.gov website belongs to an official
government organization in the United States.
Secure .gov websites use HTTPS
A lock (
) or https:// means you've safely
connected to the .gov website. Share sensitive
information only on official, secure websites.
Map of the United States Showing Geographic Distribution of Health Service Area Quintiles. (Quintile 1 = Lowest Rate of Pancreatectomy and Increases to Quintile 5 = Highest Rate of pancreatectomy)