Fig. 3.
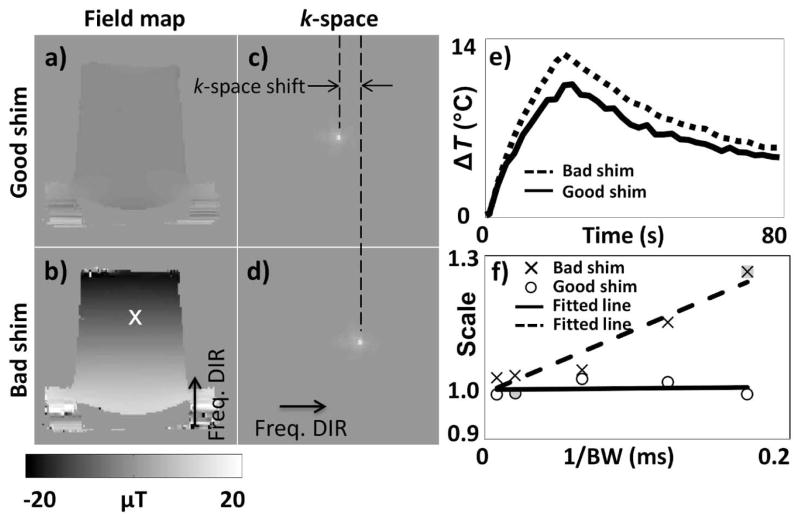
Field maps and associated k-space data were obtained using: Properly adjusted shim parameters (a,c), and manually de-adjusted shim parameters (a 0.308 mT/m offset was added to the vertically oriented, physical-y orientation) (b,d). The manually introduced shim term was spatially linear in this case, which caused a simple global shift in k-space in (d). Several heating experiments were performed while varying the imaging bandwidth, with proper and with de-adjusted shimming. e) The heating curve obtained at focus is shown for the case BW = ±5.8 kHz and de-adjusted shimming (dashed curve) and for the case BW = ±50 kHz and proper shimming (solid curve). The two curves were found to differ by a multiplicative factor of 1.26 in this case. Such multiplicative factor, obtained for each heating experiment using the solid line from (e) as a reference, is plotted in (f) as a function of the inverse of the imaging bandwidth, 1/BW. Regardless of bandwidth, properly-shimmed experiments yielded accurate results, as determined by the fact that a scaling factor of about 1.0 was obtained (see ‘○’ symbols in (f)). As expected, temperature results obtained with de-adjusted shim parameters were affected through a multiplicative factor that increased linearly with 1/BW (‘×’ symbols). Gray-filled symbols in (f) represent the two cases exemplified in (e): An ‘○’ and an ‘×’ symbol with scaling value of 1.00 and 1.26, respectively.

