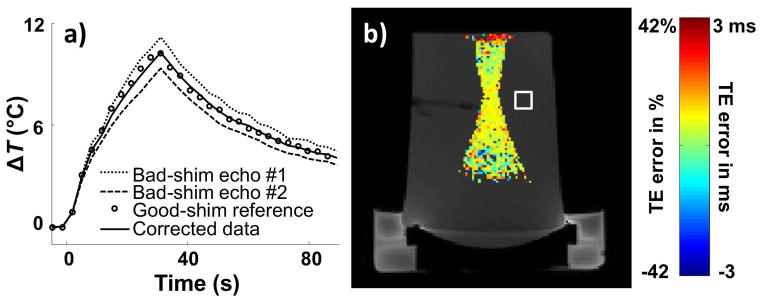
Fig. 6.

The same data as in Fig. 4 were reconstructed a second time using Eq. 10 rather than Eq. 9. a) Temperature measurements at focus are very similar to those from Fig. 4a: Corrected temperature measurements agreed very well with reference values. b) Equation 10 allows errors in τ, simply equal to TE for a regular gradient-echo signal, to be explicitly calculated wherever significant heating was present. A map of ΔTE for echo #1 (TE = 7.2 ms) is overlaid on a magnitude image, and as expected from an extra linear shim term the value of ΔTE is mostly constant spatially (value of about 0.7 ms or 10%, as measured at focus). The main advantage of using Eq. 10 (as done here) rather than Eq. 9 (as in Fig. 4) is an improved TNR. In the square ROI shown in (b), the TNR was 129 here for results calculated from Eq. 10 compared to 102 for results from Fig. 4 and Eq. 9.
