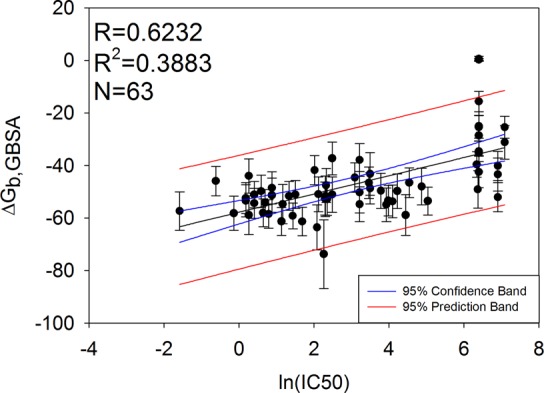
Figure 2.

Correlation between IC50 and calculated binding free energies using MM-GBSA for 63 Compstatin analogs. The blue bands correspond to the 95% confidence interval for the regression line. The red bands correspond to the 95% confidence interval for a new value to lie in the prediction band. Error bars are ±1 standard deviation from the mean binding free energy calculated.
