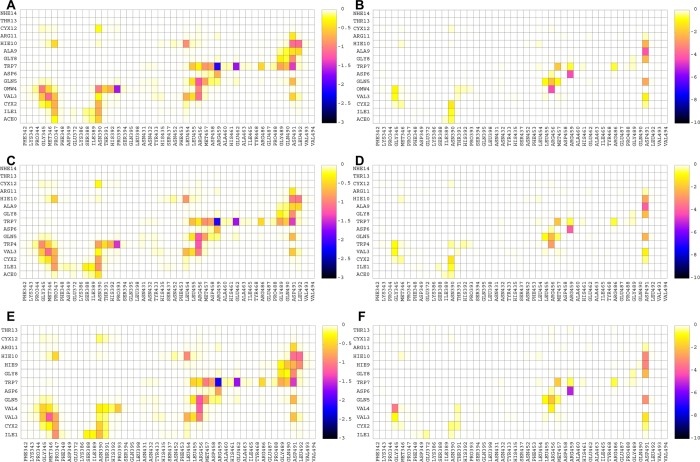
Figure 3.
(A) Nonpolar and (B) polar interaction maps for analog W4(OMW)A9. (C) Nonpolar and (D) polar interaction maps for analog W4A9. (E) Nonpolar and (F) polar interaction maps for native Compstatin. The color bar represents the interaction free energy between the corresponding residue–residue pairs in kcal/mol. The color bar was scaled to be the same for the nonpolar and polar interaction free energy contributions so that the different analogues’ energetic contributions can be directly compared.

