
Figure 1.
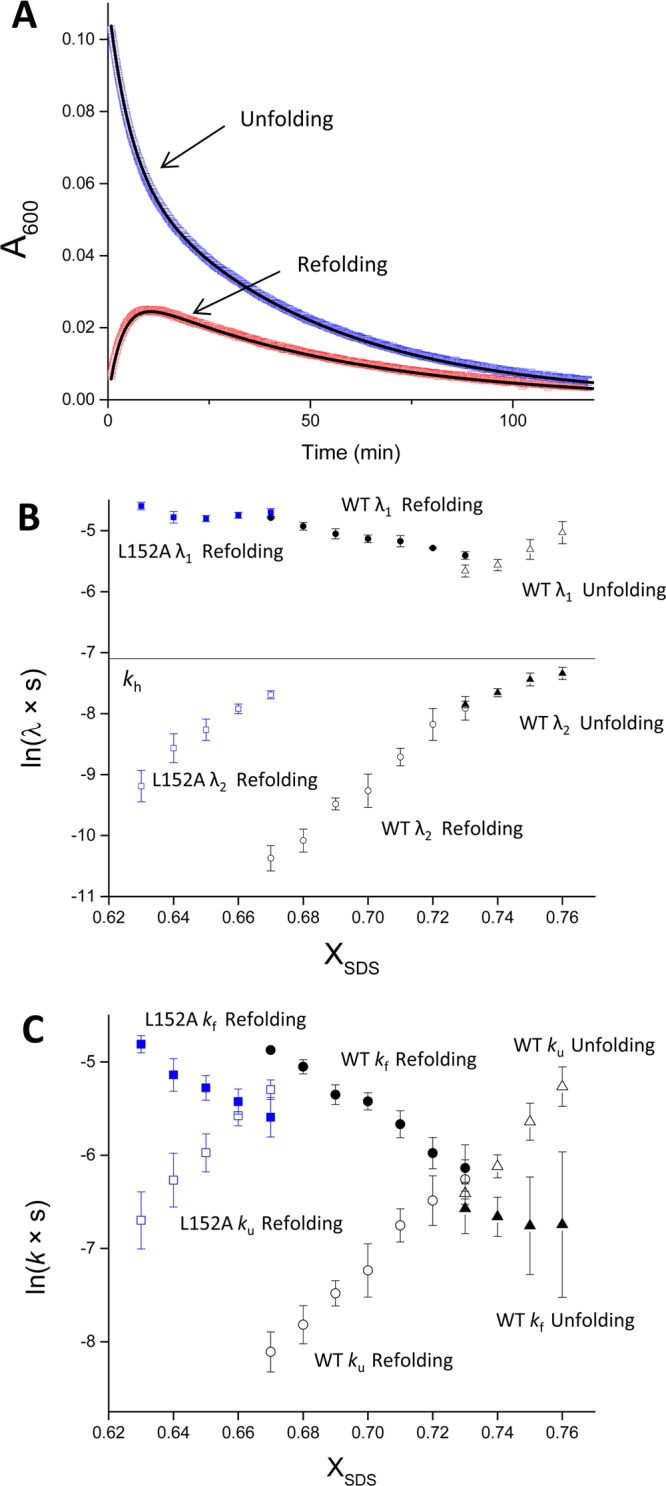
Conformational relaxation kinetics of bR in the folding transition zone. (A) The refolding of bRU (red) and unfolding of bRF (blue) monitored at XSDS = 0.73 by the absorbance of the folded protein at 600 nm (A600). The curve-fitting of the change of A600 with eq 1 is shown in black lines. (B) Dependence of the observed rate constants on XSDS. The natural logarithms of the rate constants of the fast (λ1) and slow (λ2) phases of conformational relaxation of wild-type (black) and L152A (blue) bR’s are plotted against XSDS. Whether the values were obtained from unfolding or refolding is indicated in the figure. The rate of retinal hydrolysis (kh; black line) is plotted for reference. (C) Dependence of the folding and unfolding rate constants on XSDS. The natural logarithms of the rate constants for folding (kf) and for unfolding (ku) of wild-type (black) and L152A (blue) bR’s are plotted against XSDS. Whether the values were obtained from unfolding or refolding is indicated in the figure.