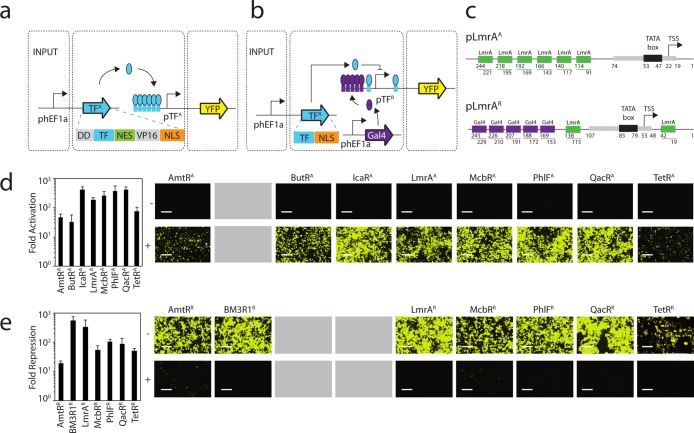
Figure 1.
Design and characterization of synthetic transcription factors. (a) Expression of TFA is controlled by the constitutive hEF1a promoter. Operator sequences are shown as boxes. pTFA controls expression of the YFP output, which is activated by its cognate transcription factor. (b) The control system for TFR is similar to part a except that Gal4-VP16 is constitutively expressed from a third plasmid. pTFR controls expression of the YFP output, which is activated by Gal4-VP16 and repressed by its cognate transcription factor. (c) A detailed positional view of the activated (pLmrAA, top) and repressed (pLmrAR, bottom) LmrA promoters is illustrated. The pLmrAA promoter contains a minimal CMV promoter core with six upstream operators. The pLmrAR promoter consists of a minimal CMV promoter that is surrounded by two LmrA operators and five upstream Gal4 operators. The corresponding transcriptional start site (TSS) and TATA box are illustrated. (d) The function of the activators are shown and compared to the TetR activator (TetRA). The fold-activation was calculated by comparing the average fluorescence in the presence of a plasmid encoding the activator (P-constitutive TFA) with that obtained from the reporter plasmid (P-pTFA reporter) in the absence of the P-constitutive TFA plasmid. Cells were grown for 48 h post-transfection and assayed using flow cytometry (Methods). Representative histograms are shown in Supporting Information Figure 5. Microscopic images of cells transfected with the reporter only (−, top panel) or the cotransfected reporter and activator (+, bottom panel) are shown. BFP transfection controls are shown in Supporting Information Figure 6. (e) The function of the repressors are shown and compared to the TetR repressor (TetRR). Fold-repression is calculated by comparing the average fluorescence in the presence and absence of the plasmid containing the repressor (P-constitutive TFR). Microscopic images of cells transfected with the reporter and Gal4-VP16 (−, top panel) or the reporter, Gal4-VP16, and the repressor (+, bottom panel) are shown. Fluorescence histograms generated from the FITC-A geometric mean and BFP transfection control images are shown in Supporting Information Figures 7 and 8, respectively. In both parts d and e, the error bars were calculated based on the standard deviation of three independent experiments performed on different days. Cells are visualized using a YFP filter at 10× magnification, and images were taken 48 h post-transfection. The scale bars correspond to 400 μm. Gray boxes indicate that a particular TetR homologue was converted into only an activator or repressor and the other version was either not built or is nonfunctional.

