
Figure 2.
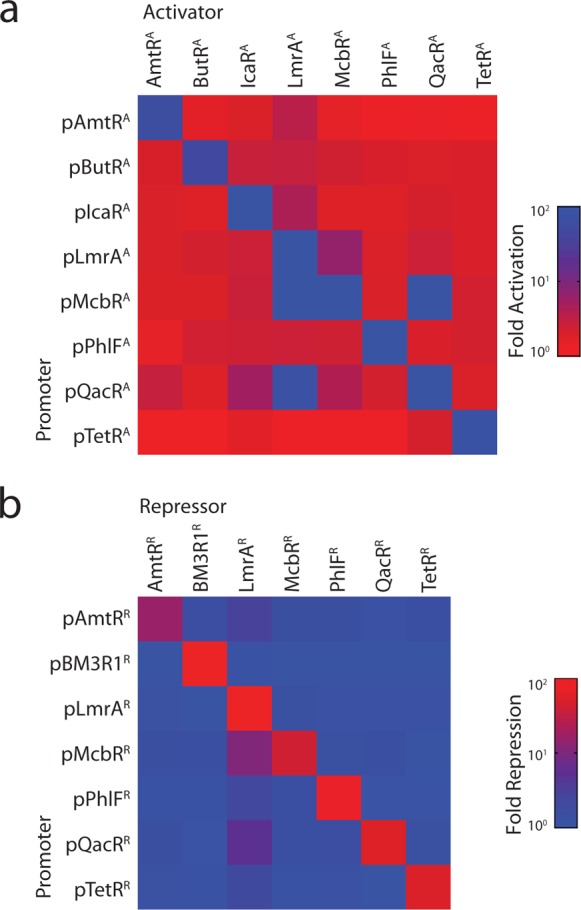
Orthogonality between synthetic transcription factors. (a) Crosstalk is shown between all combinations of activators and promoters. The fold-activation is calculated by dividing the average fluorescence of cells containing both the reporter and activator plasmids by the average fluorescence of cells only transfected with the reporter plasmid. Raw data underlying the matrix are shown in Supporting Information Figure 9, and data correspond to the average FITC-A geometric mean values from flow cytometry data collected from three independent transfections carried out on separate days. (b) Crosstalk is shown between all combinations of repressors and promoters. The fold-repression is calculated by dividing the average fluorescence of cells containing the reporter and Gal4-VP16 encoded plasmids by the fluorescence of cells transfected with plasmids encoding the reporter, Gal4-VP16, and cognate repressor. Raw data underlying the matrix are shown in Supporting Information Figure 10, and data correspond to the average FITC-A geometric mean values from flow cytometry data collected from three independent transfections carried out on separate days.