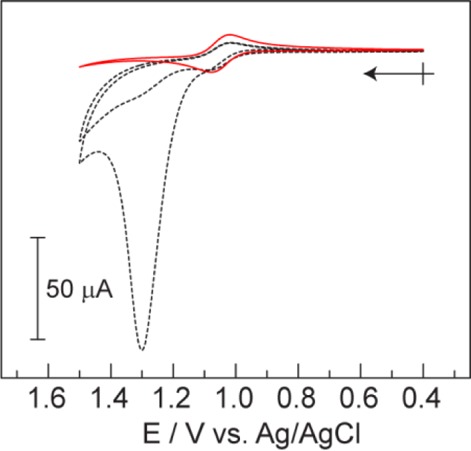
Figure 3.

Background corrected CVs of crude (black dotted) and purified (red solid) samples of 1 (0.852 mg/mL) in 0.2 M KPi buffer, pH = 7. Two scans are presented for the crude sample demonstrating the loss of activity upon the second scan. Crossed arrow indicates initial point and direction of scan.
