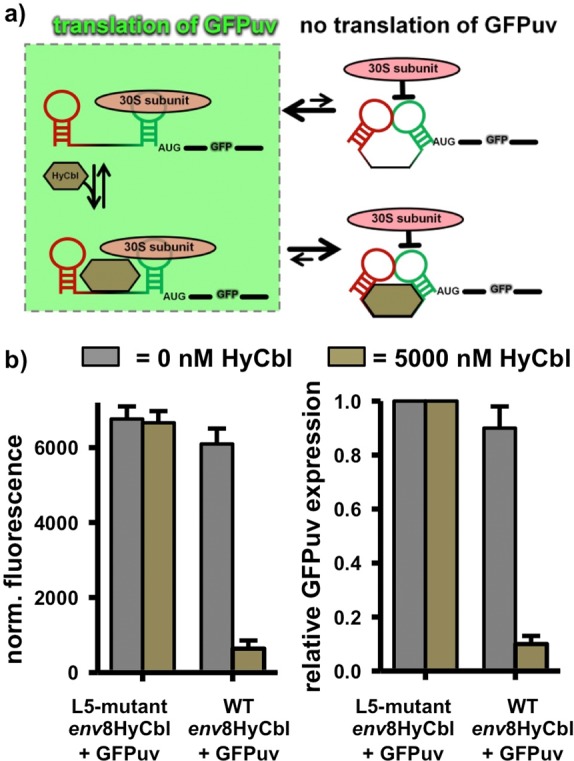
Figure 8.

Cell-based regulation of gene expression via the env8HyCbl riboswitch. (a) Schematic diagram relating the four-state kinetic model to the regulation of gene expression via inhibition of translation initiation. (b) Histograms comparing the normalized fluorescence and relative GFPuv expression of cell cultures grown in the presence (bronze bars) or absence (gray bars) of 5000 nM HyCbl.
