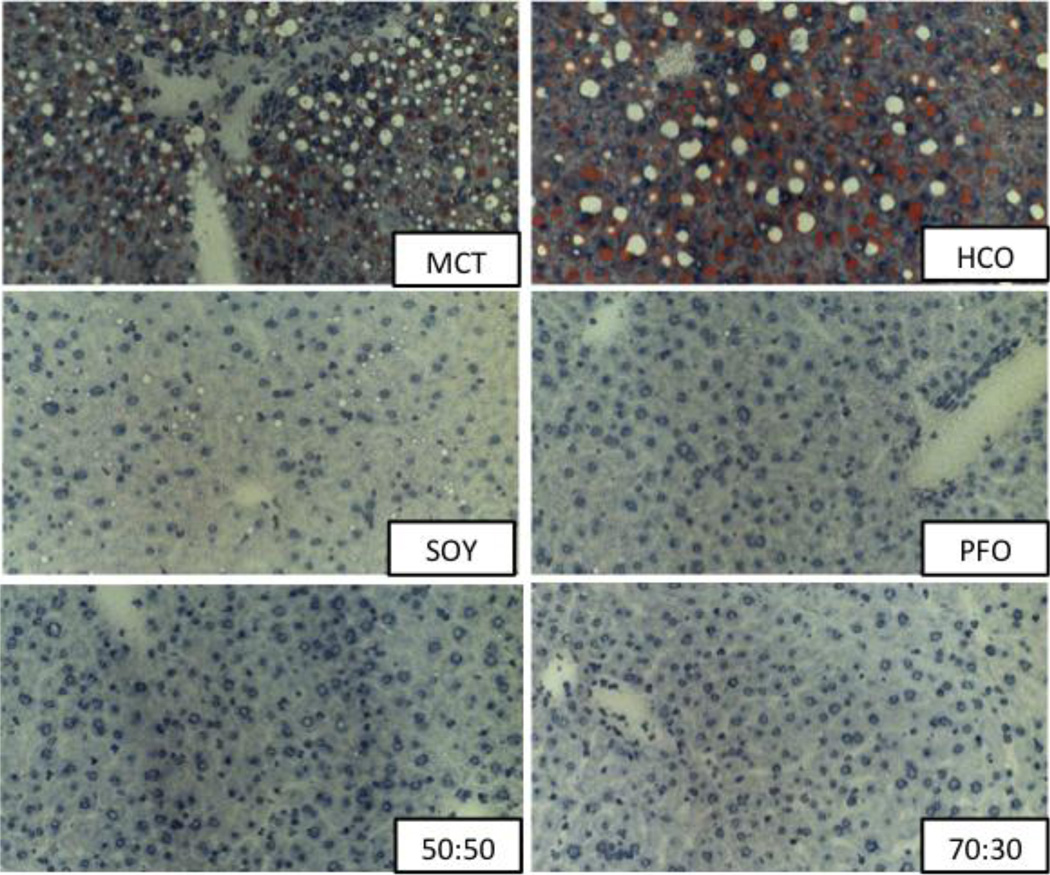
Figure 6.
Liver samples stained for Oil Red O. All MCT and HCO livers demonstrated significant peri-portal and mid-zonal micro- and macrosteatosis. SOY livers showed rare to mild mid-zonal microsteatosis. PFO, 50:50 MCT:PFO and 70:30 MCT:PFO livers appeared normal without evidence of hepatosteatosis.

