Figure 1.

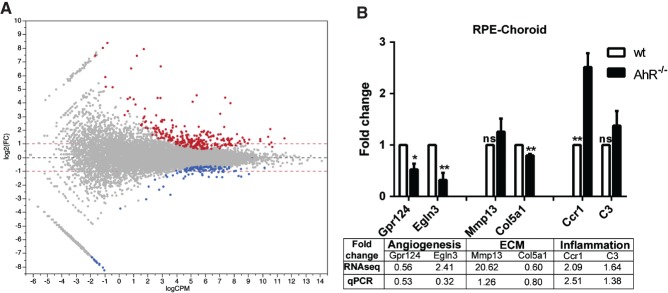
Perturbations of gene expression in RPE-choroid tissue from 11–13 month-old AhR−/− versus wild-type mice. (A) Horizontal axis, log10 of average counts/million (CPM) bases across all samples; vertical axis, log2 of fold change (FC) between knock-out and wild-type animals; each dot represents a feature (gene). Genes regulated at significance level of 0.05 after adjustment for multiple comparisons by FDR are highlighted; up-regulation (red) or repression in knock-out (blue) compared to wild-type. A total of 268 genes are up-regulated in knock-out, while 124 are repressed; red horizontal dashed lines indicate two-fold change level. Among the induced genes, 205 of 268 genes are up-regulated by > 2-fold, while among the repressed genes, 44 of 124 are repressed by > 2-fold; all significantly regulated genes are regulated by > 1.5-fold. (B) qPCR validation of select angiogenic [Gpr124 and hypoxia inducible factor 3 (Egln3)], extracellular matrix (ECM; Mmp13 and Col5a1) and inflammatory (Ccr1 and C3) genes in AhR−/− and wt mouse RPE/choroid samples (n = 3/genotype; *p < 0.05, **p < 0.01; ns, not significant). Table illustrates fold change as seen by RNA-seq compared to qPCR
