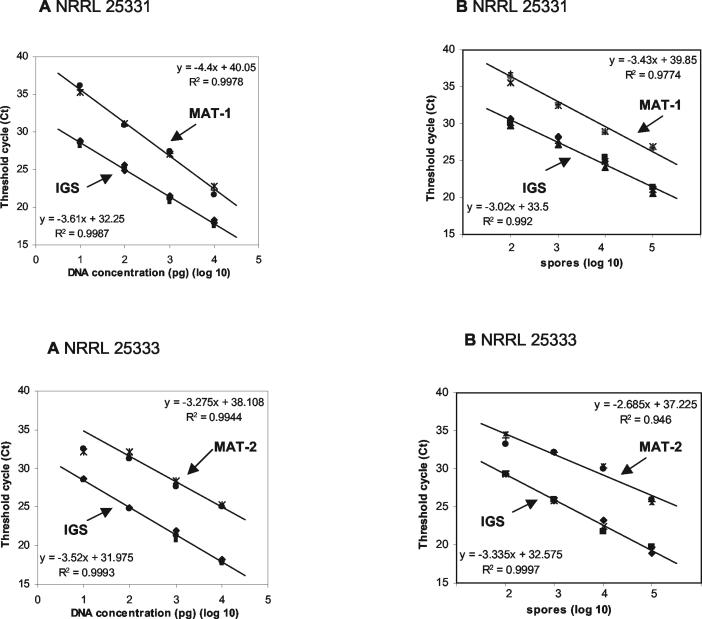
FIG. 3.
Standard curves quantifying DNAs of F. circinatum strains NRRL 25331 (MAT-1) and NRRL 25333 (MAT-2) obtained by real-time PCR with SYBR-Green as the fluorescent dye. Ct values, corresponding to the increase in template DNA above the background level, were plotted against the log of genomic DNA standards of known concentrations (n = 3). DNA amplification was done with the primer combination CIRC1A-CIRC4A for the multicopy ribosomal IGS gene and the primer pairs for the single-copy mating type genes MAT-1 and MAT-2, respectively. (A) Standard curves obtained with DNA extracted from mycelium in the range of 101 to 104 pg per reaction. (B) Standard curves obtained with DNA extracted from a spore suspension in the range of 102 to 105 spores/100 μl.

